Sabina Park: a bowler's haven that produces results
Stats preview of the second Test between West Indies and India at Sabina Park
Shiva Jayaraman
Jul 29, 2016, 6:40 AM
ESPNcricinfo Ltd
1998 Last time a Test was drawn at Sabina Park, which was between the hosts and England. Since then there have been 15 Tests played at this venue and all have ended in a decisive result. Among 32 venues that have hosted at least ten Tests since 1999, Sabina Park in the only venue which hasn't witnessed a draw.
3-7 West Indies' win-loss record in their last ten Tests in Kingston. They last won a Test here in 2012, when they beat New Zealand by 5 wickets but have lost on two subsequent occasions, to New Zealand in 2014 and to Australia last year. West Indies have a 6-2 win-loss record against India at this venue with the losses coming in their previous two Tests here against the visitors.
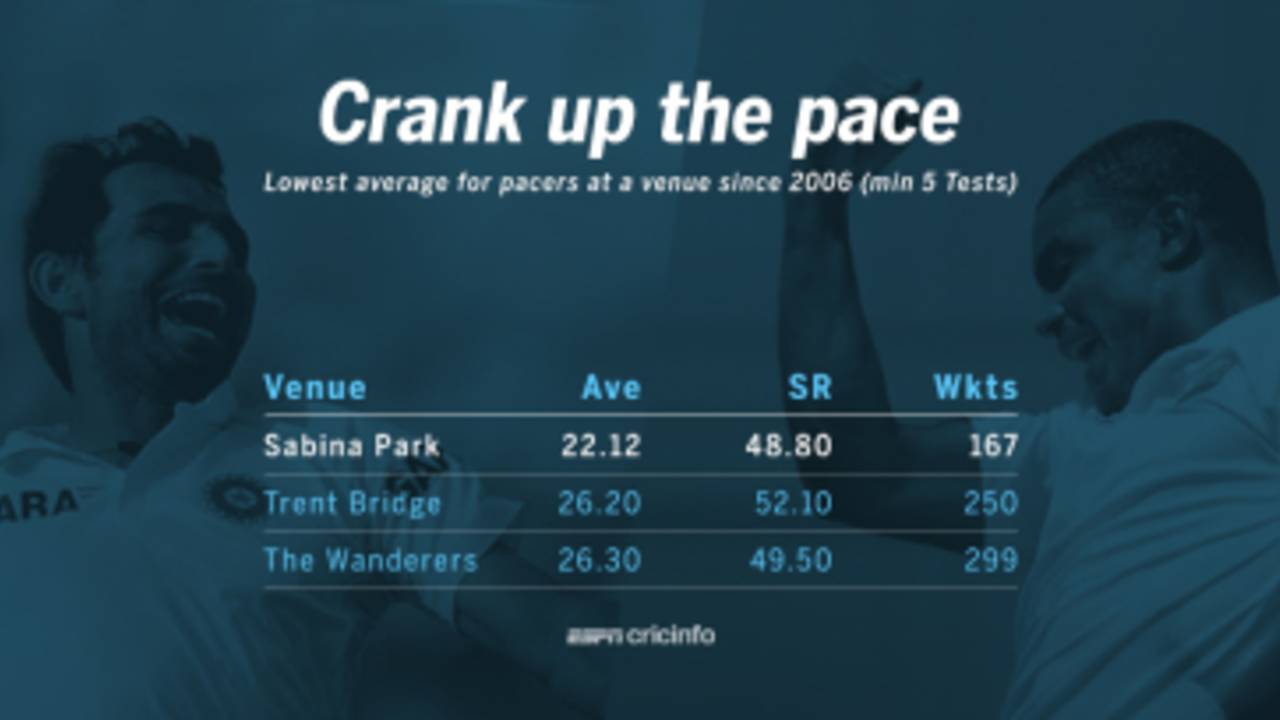
22.12 Fast bowlers' average at the Sabina Park in Tests since 2006 - the best they have averaged at any venue that has hosted at least five Tests in this period. Pacers have taken eight five-fors in seven Tests at this venue since 2006 and strike every 48.8 deliveries which is also the lowest at any venue. Overall, bowlers average 24.74 per wicket at Sabina Park, which is the the lowest they average at any venue that has hosted five or more Tests since 2006. Their average here is nearly three runs better than the Wanderers, Johannesburg, which is second in this list.
20.73 Batting average of batsmen in the current West Indies squad at Sabina Park. West Indies batsmen have scored a total of 539 runs with one hundred and four fifties at this venue. Marlon Samuels is the leading run-scorer among them - he has made 258 runs at 28.66 at this venue with a century and two fifties. In his last Test here in 2014, however, Samuels got a pair against New Zealand.
7 wickets by Devendra Bishoo in Tests at Sabina Park - the most by a West Indies bowler in their current squad. All those seven wickets came against India in 2011 when he got 7 for 140 in the match. Jason Holder is the only other West Indies bowler with a Test wicket at this venue. He took 2 for 88 in a Test against Australia last year.
13.76 Alzarri Joseph's bowling average in the 2016 Under-19 World Cup. Joseph took 13 wickets at an economy of 3.31 in the series, including 3 for 39 in the final against India. Joseph also bowled the fastest ball of the series, at 143 Kmph, to clean bowl Zimbabwe's Brendan Sly earlier in the tournament. Joseph has taken 24 wickets in first-class cricket from eight matches at an average of 24.45.
28.92 Cheteshwar Pujara's batting average in Tests outside the subcontinent as opposed to an average of 67.75 in the subcontinent. He has made four fifty-plus scores in 28 innings outside Asia, the last of which came against Australia in the first innings of the Adelaide Test in 2014-15. Pujara's only hundred outside the subcontinent was in the second innings of the Johannesburg Test in 2013-14. In fact, among India batsmen to have played at least ten innings in the top order (No. 1 to No. 7) in Tests outside the subcontinent since 2014, Pujara's average of 23.76 is the lowest.
| Batsman | Inns | Runs | HS | Ave | 100s/50s |
| Virat Kohli | 23 | 1240 | 200 | 56.36 | 6/2 |
| Ajinkya Rahane | 22 | 882 | 147 | 44.10 | 3/4 |
| M Vijay | 23 | 939 | 146 | 40.82 | 2/6 |
| Shikhar Dhawan | 17 | 588 | 115 | 34.58 | 1/3 |
| MS Dhoni | 16 | 466 | 82 | 31.06 | 0/4 |
| Rohit Sharma | 12 | 329 | 72 | 29.90 | 0/2 |
| Cheteshwar Pujara | 21 | 499 | 73 | 23.76 | 0/2 |
19.21 Ishant Sharma's bowling average in Tests in West Indies - easily his best in any country. Ishant has taken 23 wickets including two five-wicket hauls in four Tests here. In India's last series in West Indies in 2011 he took 22 wickets at 16.86 in three Tests, including 6 for 110 in the Test in Kingston.
Shiva Jayaraman is a senior sub-editor (stats) at ESPNcricinfo.com. @shiva_cricinfo