SL's top order v SA's middle order
A stats preview to the first quarter-final of the World Cup, between South Africa and Sri Lanka
S Rajesh
17-Mar-2015
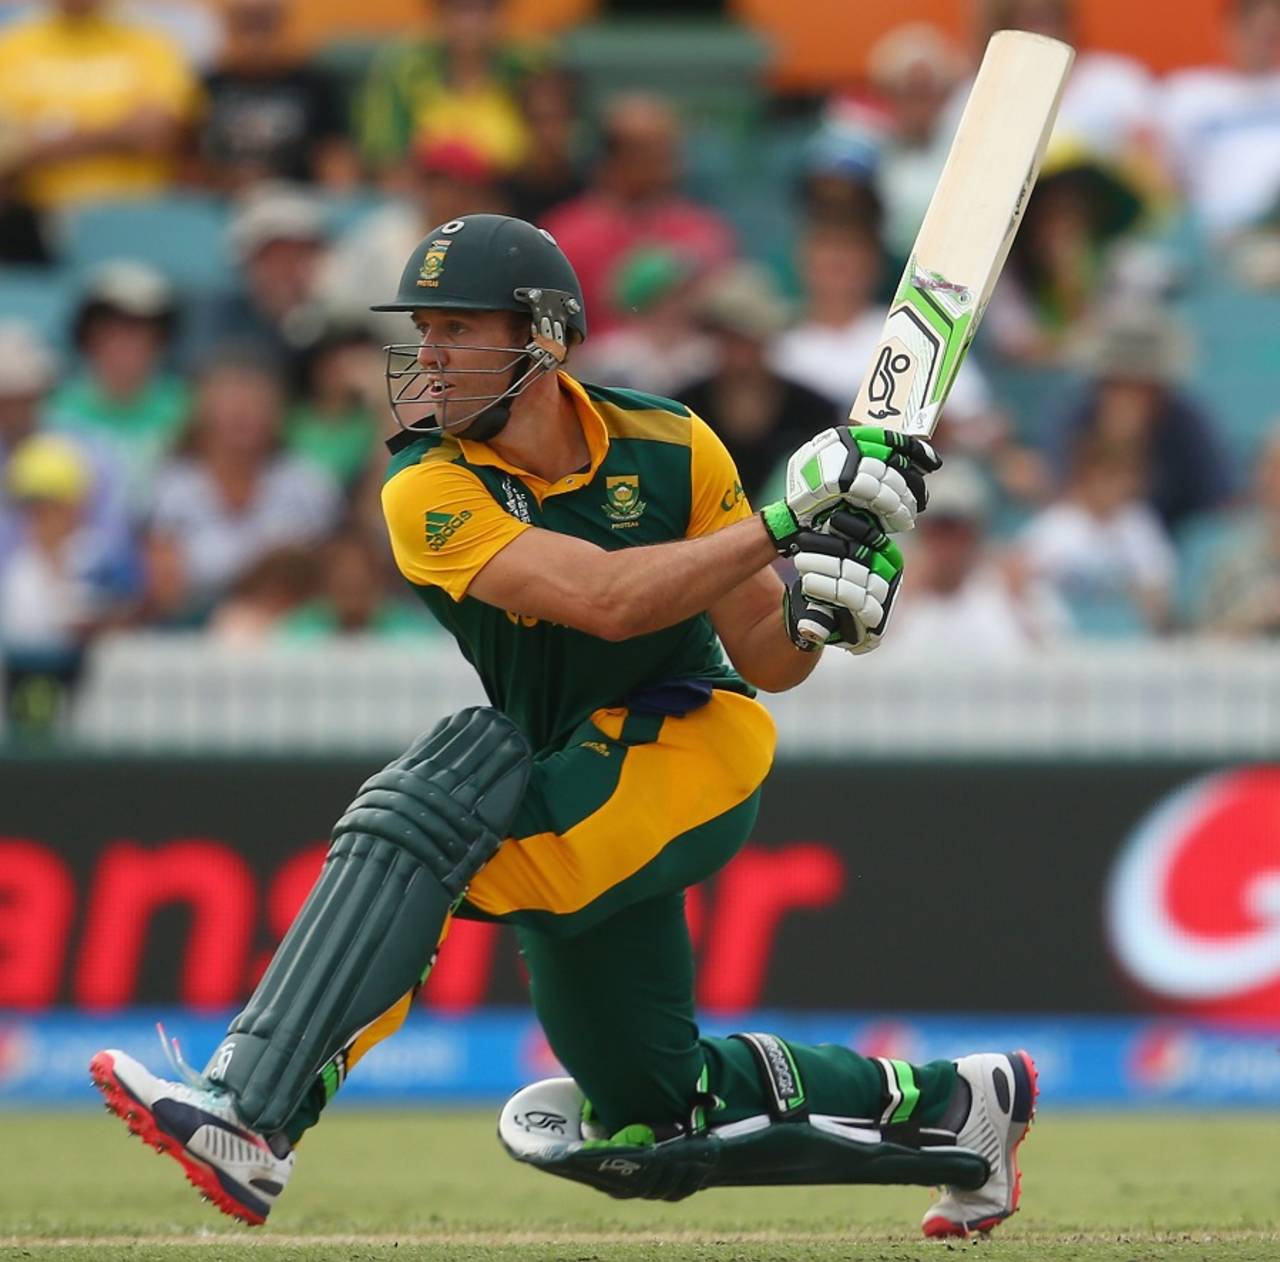
AB de Villiers has scored 128 runs from 46 balls when batting in the last ten overs in this tournament • Getty Images
6 The number of successive knockout matches that South Africa have lost in the World Cup or Champions Trophy tournaments, dating back to the semi-final of the Champions Trophy tournament in 2000. Most recently, they lost the 2013 Champions Trophy semi-final against England, and the 2011 World Cup quarter-final against New Zealand.
7-6 Sri Lanka's win-loss record against South Africa in ODIs between the two teams since the last World Cup. In Sri Lanka, they have a 5-3 record, while South Africa have a 3-2 edge in South Africa. Eight of these 13 games between the two sides have been won by the team batting first - four each by Sri Lanka and South Africa.
15-15 South Africa's win-loss record when batting second since the last World Cup. Among the top 10 teams, only West Indies, Bangladesh and Zimbabwe have a poorer record in chases. India have a 40-17 record when batting second, while Australia have won 20 and lost 9. When batting first, South Africa have a 28-13 record, the best win-loss ratio among all teams. Sri Lanka's record is more even: 30-26 when chasing, and 30-31 when batting first.
3-10 South Africa's win-loss record when chasing a target of 250 or more since the last World Cup. Among those ten losses, four have been when chasing targets between 260 and 299, and six when chasing 300-plus. West Indies, Zimbabwe, England and Pakistan have a worse win-loss ratio when chasing these targets, while India (16-16) and Australia (7-8) have the best.
1152 Runs scored by Sri Lanka's top three batsmen in the World Cup so far, thanks mainly to Kumar Sangakkara (496 runs at 124) and Tillakaratne Dilshan (395 runs at 79). It's by far the most among all teams: India are next with 797, while South Africa are joint fifth with an aggregate of 680 for their top three batsmen. Sri Lanka's top three have a combined average of 82.28 at a strike-rate of 102.40, compared to South Africa's 37.77 at a strike-rate of 87.85.
1067 Runs scored by South Africa's middle order (Nos. 4 to 7) in the tournament, the most by any team. They've averaged 76.21 at a strike rate at 133.04, thanks to AB de Villiers' 417 runs in six innings. Sri Lanka's middle order has averaged 31.28 at a strike rate of 94.80.
462 Balls faced by Sri Lanka's middle order, which is lower than all teams except Australia. However, Australia have played only five matches in tournament because of the washout against Bangladesh.
13.14 South Africa's scoring rate in the last ten overs in this World Cup, the best among all teams. They've scored 530 runs losing seven wickets in the last 10, an average of 75.71 runs per wicket. David Miller has scored 140 of those runs from 68 balls, while de Villiers has 128 from 46 balls. Sri Lanka average 8.01 runs per over in the last ten.
5.44 South Africa's economy rate in the last 10 overs in this tournament, the best among all teams, and the only one going at less than six an over. Sri Lanka have averaged 8.58 in this period.
5 Wickets lost by Sri Lanka in the mandatory Powerplays, the least among all teams. Their average of 60.40 runs per wicket during this period is the best. South Africa have lost eight during this period, and average 35.12 runs per wicket.
2 Wickets for Dale Steyn in the mandatory Powerplays in this tournament. He has bowled 19 overs during this period, and taken 2 for 85, an average of 42.50 runs per wicket. South Africa's best during this period has been Kyle Abbott, with figures of 5 for 55 from 13 overs. Lasith Malinga has figures of 3 for 122 from 23 overs during the mandatory Powerplays.
13 Wickets for South Africa's spinners, at an average of 34.38, compared to Sri Lanka's spinners who have 11 wickets at 47.27. Eleven of the 13 wickets for South Africa have come from Imran Tahir, who is the third-highest wicket-taker among spinners in this tournament.
S Rajesh is stats editor of ESPNcricinfo. @rajeshstats