Strong first impressions, and some weak ones
How batsmen fared in terms of average in their first outings against different teams
Travis Basevi and George Binoy
Jun 8, 2011, 3:03 AM
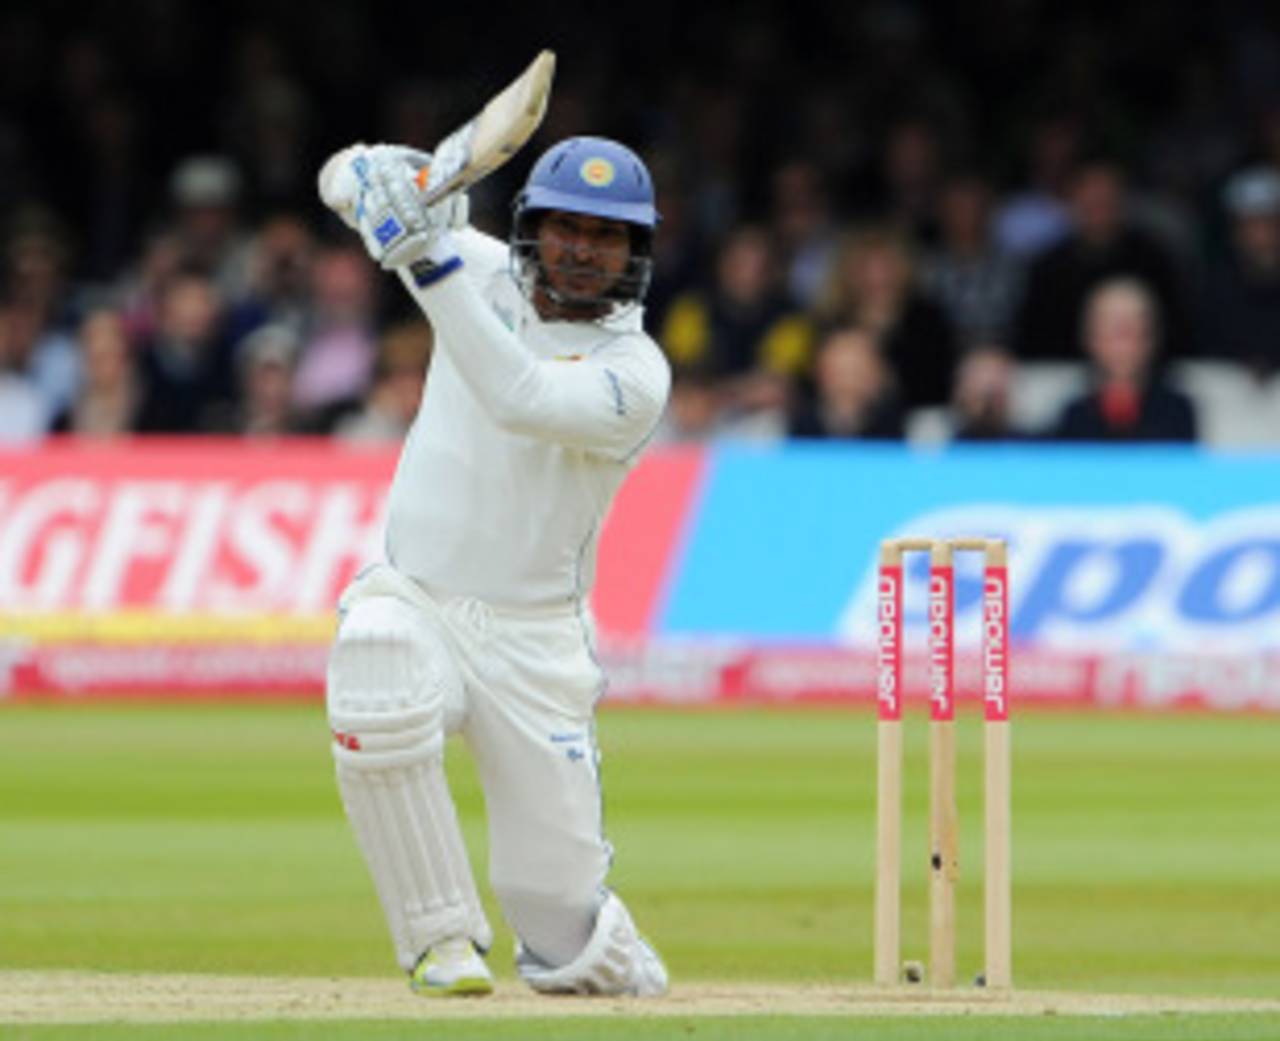
Kumar Sangakkara had a terrific start against most teams in Test cricket • Getty Images
Some batsmen have had extraordinary success when playing a team for the first time - Sunil Gavaskar, Marcus North and Kumar Sangakkara to name three. Perhaps they were unknown quantities, perhaps they had lots of beginner's luck, or perhaps they were just high-class players. Others have fared poorly under similar circumstances. Sachin Tendulkar, for instance, was a prodigiously talented teenager but a slow starter in his career. This week's List looks at how batsmen fared in terms of average in first outings against different teams.
We've only considered batsmen who played against at least five teams, which is why Don Bradman isn't in our tables. In his first Tests against the four teams he played against, Bradman made 434 runs at an average of 86.80, though he fared poorly against England and West Indies, he filled his boots against South Africa and India. India's little-known Hemu Adhikari, however, averaged 141.50 in his first Tests against four teams. He made 283 and was not out in four out of six innings.
Sangakkara had a terrific start against most teams in Test cricket, amassing 848 runs in 11 innings at an average of 94.22. He made 23 against South Africa, 58 against England, 105 not out against India, 54 against Bangladesh, 140 against West Indies, 128 against Zimbabwe, 230 and 14 not out against Pakistan, 67 against New Zealand and 22 and 7 against Australia, whom he played for the first time in 2004, despite debuting in 2000.
| Player | Span | Mat | Inns | Runs | Ave | HS | 100 | 50 | Career | Mat | Ave | |
|---|---|---|---|---|---|---|---|---|---|---|---|---|
| AI Kallicharran (WI) | 1972-1975 | 5 | 9 | 606 | 101.00 | 124 | 2 | 4 | 1972-1981 | 66 | 44.43 | |
| KC Sangakkara (SL) | 2000-2004 | 9 | 11 | 848 | 94.22 | 230 | 4 | 3 | 2000-2011 | 95 | 56.63 | |
| G Boycott (Eng) | 1964-1967 | 6 | 9 | 535 | 89.16 | 246* | 1 | 2 | 1964-1982 | 108 | 47.72 | |
| DI Gower (Eng) | 1978-1982 | 6 | 10 | 624 | 89.14 | 200* | 2 | 2 | 1978-1992 | 117 | 44.25 | |
| SM Gavaskar (India) | 1971-1982 | 6 | 12 | 712 | 89.00 | 155 | 3 | 4 | 1971-1987 | 125 | 51.12 | |
| GS Chappell (Aus) | 1970-1983 | 6 | 7 | 522 | 87.00 | 204 | 2 | 2 | 1970-1984 | 87 | 53.86 | |
| JH Edrich (Eng) | 1963-1969 | 6 | 9 | 598 | 85.42 | 310* | 2 | 1 | 1963-1976 | 77 | 43.54 | |
| MJ Greatbatch (NZ) | 1988-1992 | 6 | 12 | 655 | 81.87 | 146* | 2 | 4 | 1988-1996 | 41 | 30.62 | |
| GC Smith (SA) | 2002-2005 | 9 | 15 | 1146 | 81.85 | 277 | 4 | 3 | 2002-2011 | 91 | 49.71 | |
| NC O'Neill (Aus) | 1958-1963 | 5 | 9 | 480 | 80.00 | 181 | 1 | 2 | 1958-1965 | 42 | 45.55 | |
| MA Taylor (Aus) | 1989-1993 | 7 | 12 | 858 | 78.00 | 170 | 4 | 3 | 1989-1999 | 104 | 43.49 | |
| Zaheer Abbas (Pak) | 1969-1982 | 6 | 10 | 777 | 77.70 | 274 | 3 | 1 | 1969-1985 | 78 | 44.79 | |
| MJ North (Aus) | 2009-2010 | 6 | 8 | 456 | 76.00 | 125* | 3 | 1 | 2009-2010 | 21 | 35.48 | |
| KF Barrington (Eng) | 1955-1963 | 6 | 8 | 524 | 74.85 | 139 | 3 | 1 | 1955-1968 | 82 | 58.67 | |
| BL D'Oliveira (Eng) | 1966-1969 | 5 | 9 | 445 | 74.16 | 109 | 1 | 3 | 1966-1972 | 44 | 40.06 |
Sangakkara and Gavaskar, who averaged 89 in first Tests against six opponents, went on to build tremendously on those bright starts. North is an example of someone who didn't. He scored 456 runs at an average of 76 in eight innings, with hundreds against South Africa, England and New Zealand, and a half-century against West Indies. Unfortunately for him, his bad days outnumbered his good ones and his form against most countries deteriorated. He presently averages 35 and has not had his central contract renewed by Cricket Australia.
Tendulkar scored only one half-century in 13 innings in his first matches against each of the nine other Test countries. He made 258 runs at an average of 19.84, so some of the opponents might have wondered what the fuss was about. They were to find out soon enough, though.
Tendulkar followed the 15 in his first Test against Pakistan in 1989 with 59 in the second, his 0 and 24 against New Zealand with 88, and his 10 and 27 at Lord's with 68 and 119 not out at Old Trafford in 1990. In his first game against Australia, Tendulkar made 16 and 7 at the Gabba in 1991-92, but a match later he was celebrating a century at the SCG. He made a duck in Harare in 1992, but scored 62 the next time he played Zimbabwe, in Delhi the following year. He began against South Africa with 11 in Durban but bounced back to score 111 at the Wanderers. He followed his 11 against Sri Lanka in Chandigarh 1990 with 104 not out at the SSC in 1993, and his 34 and 85 against West Indies in 1994, with 179. Only against Bangladesh, in 2000, was he already an established great, and he made 18. Four years later he scored his highest Test score - 248 - in Dhaka.
| Player | Span | Mat | Inns | Runs | Ave | HS | 100 | 50 | Career | Mat | Ave | |
|---|---|---|---|---|---|---|---|---|---|---|---|---|
| Aamer Malik (Pak) | 1987-1989 | 5 | 7 | 79 | 15.80 | 32 | 0 | 0 | 1987-1994 | 14 | 35.31 | |
| PJP Burge (Aus) | 1955-1959 | 5 | 7 | 98 | 16.33 | 35 | 0 | 0 | 1955-1966 | 42 | 38.16 | |
| RM Cowper (Aus) | 1964-1966 | 5 | 8 | 148 | 18.50 | 81 | 0 | 1 | 1964-1968 | 27 | 46.84 | |
| A Symonds (Aus) | 2004-2008 | 6 | 11 | 216 | 19.63 | 44 | 0 | 0 | 2004-2008 | 26 | 40.61 | |
| SR Tendulkar (India) | 1989-2000 | 9 | 13 | 258 | 19.84 | 85 | 0 | 1 | 1989-2011 | 177 | 56.94 | |
| WJ Edrich (Eng) | 1938-1954 | 6 | 7 | 143 | 20.42 | 71 | 0 | 1 | 1938-1955 | 39 | 40.00 | |
| Majid Khan (Pak) | 1964-1982 | 6 | 9 | 184 | 20.44 | 63 | 0 | 1 | 1964-1983 | 63 | 38.92 | |
| Mushtaq Mohammad (Pak) | 1959-1972 | 5 | 10 | 210 | 21.00 | 76 | 0 | 1 | 1959-1979 | 57 | 39.17 | |
| MW Gatting (Eng) | 1978-1993 | 6 | 9 | 168 | 21.00 | 51* | 0 | 1 | 1978-1995 | 79 | 35.55 | |
| BP Nash (WI) | 2008-2011 | 6 | 9 | 189 | 21.00 | 64 | 0 | 2 | 2008-2011 | 20 | 35.25 | |
| JG Wright (NZ) | 1978-1983 | 6 | 11 | 237 | 21.54 | 55 | 0 | 1 | 1978-1993 | 82 | 37.82 | |
| Imran Khan (Pak) | 1971-1982 | 6 | 8 | 179 | 22.37 | 48 | 0 | 0 | 1971-1992 | 88 | 37.69 | |
| JV Coney (NZ) | 1974-1983 | 6 | 11 | 250 | 22.72 | 84 | 0 | 1 | 1974-1987 | 52 | 37.57 | |
| RJ Shastri (India) | 1981-1992 | 8 | 12 | 207 | 23.00 | 42 | 0 | 0 | 1981-1992 | 80 | 35.79 | |
| MD Crowe (NZ) | 1982-1994 | 8 | 14 | 324 | 23.14 | 83 | 0 | 2 | 1982-1995 | 77 | 45.36 |
An average of 47 in one-day cricket would be a rather sought-after statistic in modern cricket. Glenn Turner had it at the end of a ten-year career that ended in 1983, after scoring 1598 runs in 40 innings. He had an average of 111.25 from all his first games against teams, though he began poorly against Pakistan, Australia and England. He had success against India - one century, two fifties, three unbeaten innings and an average of 272 in four matches.
| Player | Span | Mat | Inns | Runs | Ave | HS | 100 | 50 | Career | Mat | Ave | |
|---|---|---|---|---|---|---|---|---|---|---|---|---|
| GM Turner (NZ) | 1973-1979 | 7 | 7 | 445 | 111.25 | 171* | 2 | 1 | 1973-1983 | 41 | 47.00 | |
| MEK Hussey (Aus) | 2004-2011 | 13 | 12 | 534 | 89.00 | 109* | 1 | 4 | 2004-2011 | 158 | 51.41 | |
| KP Pietersen (Eng) | 2004-2011 | 14 | 12 | 550 | 78.57 | 91* | 0 | 5 | 2004-2011 | 114 | 40.98 | |
| A Ranatunga (SL) | 1982-1996 | 10 | 10 | 375 | 75.00 | 88* | 0 | 3 | 1982-1999 | 269 | 35.84 | |
| CG Greenidge (WI) | 1975-1985 | 7 | 7 | 374 | 74.80 | 106* | 2 | 2 | 1975-1991 | 128 | 45.03 | |
| Basit Ali (Pak) | 1993-1994 | 8 | 7 | 218 | 72.66 | 75* | 0 | 2 | 1993-1996 | 50 | 34.18 | |
| RR Sarwan (WI) | 2000-2011 | 14 | 13 | 492 | 70.28 | 56* | 0 | 1 | 2000-2011 | 169 | 43.18 | |
| N Hussain (Eng) | 1989-2003 | 11 | 10 | 406 | 67.66 | 95 | 0 | 2 | 1989-2003 | 88 | 30.28 | |
| LRPL Taylor (NZ) | 2006-2011 | 13 | 12 | 594 | 66.00 | 128* | 1 | 5 | 2006-2011 | 107 | 36.80 | |
| G Kirsten (SA) | 1993-2003 | 13 | 13 | 589 | 65.44 | 188* | 1 | 4 | 1993-2003 | 185 | 40.95 | |
| MD Crowe (NZ) | 1982-1992 | 9 | 7 | 327 | 65.40 | 97 | 0 | 3 | 1982-1995 | 143 | 38.55 | |
| Yuvraj Singh (India) | 2000-2007 | 16 | 13 | 587 | 65.22 | 102* | 1 | 4 | 2000-2011 | 274 | 37.62 | |
| KJJ van Noortwijk (Neth) | 1996-2003 | 7 | 7 | 315 | 63.00 | 134* | 1 | 1 | 1996-2003 | 9 | 46.00 | |
| JEC Franklin (NZ) | 2001-2011 | 12 | 9 | 186 | 62.00 | 72* | 0 | 1 | 2001-2011 | 89 | 24.02 | |
| SC Ganguly (India) | 1992-2007 | 15 | 14 | 673 | 61.18 | 112* | 1 | 6 | 1992-2007 | 311 | 41.02 |
Allan Border had a poor start against every team in his one-day career - 80 runs in eight innings, with a high score of 25 (in his only game against Canada). Only West Indies' Runako Morton has fared worse - an average of 5.25 in eight innings. Border, however, went on to forge a 273-ODI career alongside a glittering Test record. Had Morton been in a previous West Indian era, he might never have had the opportunity to make an international debut.
| Player | Span | Mat | Inns | Runs | Ave | HS | 100 | 50 | Career | Mat | Ave | |
|---|---|---|---|---|---|---|---|---|---|---|---|---|
| RS Morton (WI) | 2002-2008 | 11 | 8 | 42 | 5.25 | 17 | 0 | 0 | 2002-2010 | 56 | 33.75 | |
| AR Border (Aus) | 1979-1992 | 10 | 8 | 80 | 10.00 | 25 | 0 | 0 | 1979-1994 | 273 | 30.62 | |
| ADR Campbell (Zim) | 1992-1997 | 10 | 8 | 81 | 10.12 | 29 | 0 | 0 | 1992-2003 | 188 | 30.50 | |
| VVS Laxman (India) | 1998-2004 | 11 | 11 | 139 | 13.90 | 25 | 0 | 0 | 1998-2006 | 86 | 30.76 | |
| SHT Kandamby (SL) | 2004-2010 | 8 | 7 | 101 | 14.42 | 53 | 0 | 1 | 2004-2010 | 33 | 32.56 | |
| Saleem Malik (Pak) | 1982-1999 | 13 | 10 | 161 | 17.88 | 41 | 0 | 0 | 1982-1999 | 283 | 32.88 | |
| CL White (Aus) | 2005-2011 | 13 | 11 | 167 | 18.55 | 42 | 0 | 0 | 2005-2011 | 87 | 35.12 | |
| AP Kuiper (SA) | 1991-1992 | 8 | 7 | 113 | 18.83 | 43 | 0 | 0 | 1991-1996 | 25 | 33.68 | |
| Imran Farhat (Pak) | 2001-2006 | 10 | 10 | 174 | 19.33 | 38* | 0 | 0 | 2001-2010 | 37 | 30.94 | |
| Mahmudullah (Ban) | 2007-2011 | 12 | 10 | 160 | 20.00 | 42 | 0 | 0 | 2007-2011 | 68 | 30.90 | |
| ST Jayasuriya (SL) | 1989-2007 | 15 | 14 | 264 | 20.30 | 44 | 0 | 0 | 1989-2009 | 444 | 32.43 | |
| MA Taylor (Aus) | 1989-1996 | 10 | 9 | 188 | 20.88 | 66 | 0 | 1 | 1989-1997 | 113 | 32.23 | |
| AB de Villiers (SA) | 2005-2008 | 13 | 13 | 275 | 21.15 | 62 | 0 | 2 | 2005-2011 | 119 | 45.68 | |
| SM Gavaskar (India) | 1974-1983 | 8 | 8 | 151 | 21.57 | 65* | 0 | 1 | 1974-1987 | 108 | 35.13 | |
| A Flintoff (Eng) | 1999-2008 | 14 | 8 | 174 | 21.75 | 50 | 0 | 1 | 1999-2009 | 141 | 32.01 |
Travis Basevi is a cricket statistician and UK Senior Programmer for Cricinfo and other ESPN sports websites. George Binoy is an Assistant Editor at ESPNcricinfo