The worst country for a touring spinner
Overseas slow bowlers have struggled in Australia more than in any other country
S Rajesh
12-Nov-2010
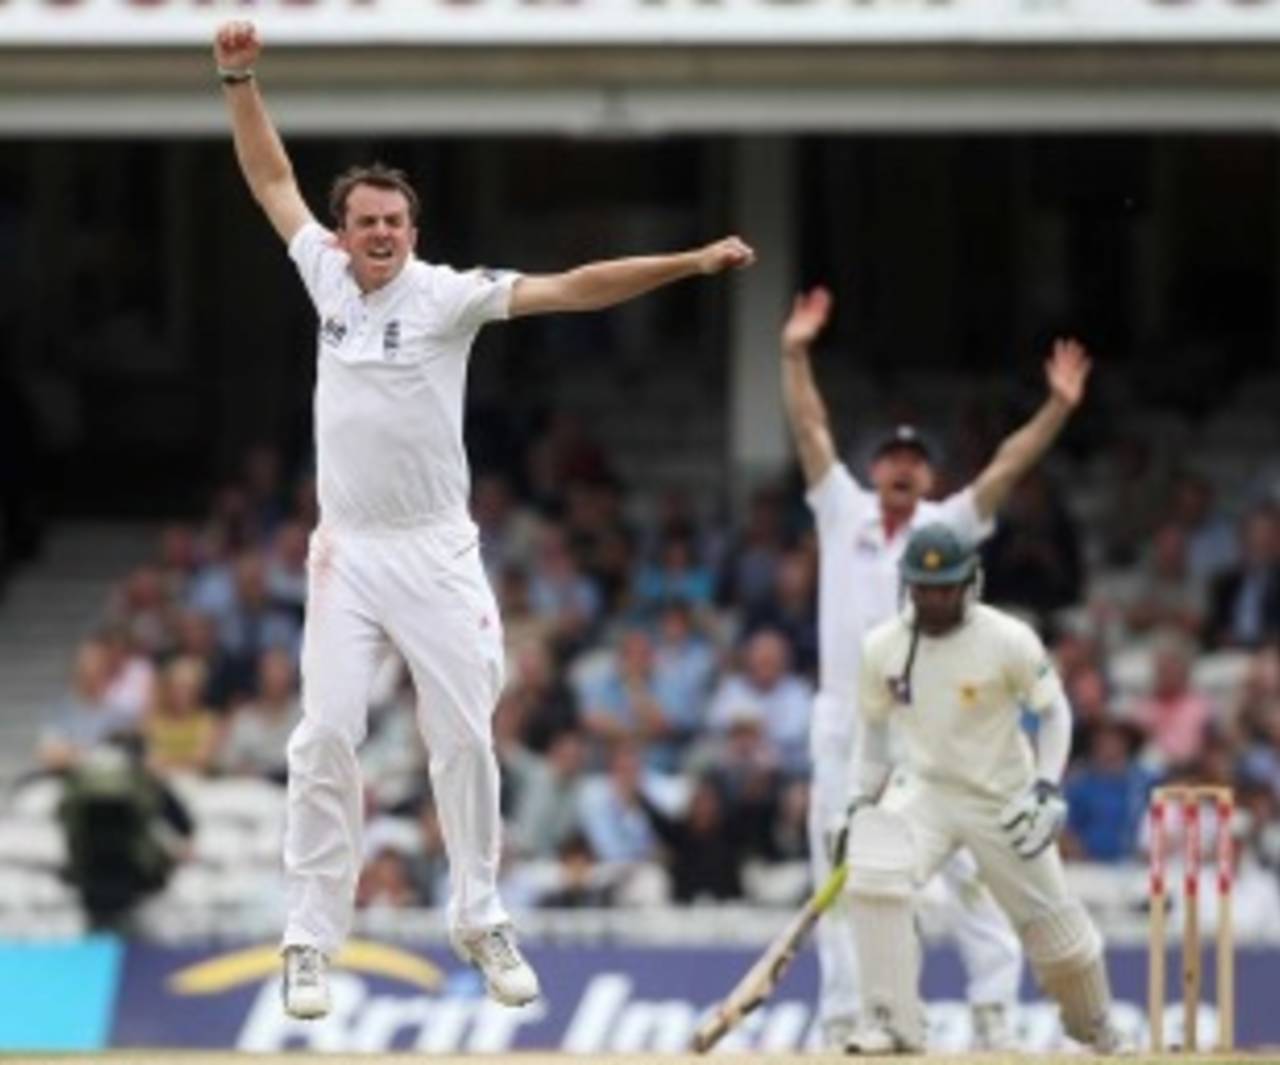
Graeme Swann has a fine opportunity to reverse the trend of overseas spinners performing poorly in Australia • Getty Images
Will Graeme Swann turn out to be the crucial difference between Australia and England in the forthcoming Ashes series? Opinions are divided - some are sure his skills will win him battles in all conditions against all opponents, while others question the quality of some of his wickets. What's certain, though, is that he'll have to go against recent trends if he is to do well - overseas spinners and Australian conditions haven't made for a happy combination in the last several years. Here's a look at how overseas spinners have performed in each country, and just how tough it's been for even the best of them in Australia.
Let's start with the stats of spinners in each country, both home and away, since 2000. As the averages column for away spinners indicates, Australia has been the worst venue for them: they've conceded almost 49 runs per wicket, which is much worse than the numbers that Australian spinners have put up. The numbers for Australia are largely the result of displays by Shane Warne and Stuart MacGill - both have taken more than 100 wickets at averages of around 30. The difference between the averages for home and away spinners in Australia is almost 17, which is second only to the difference in Sri Lanka. However, both in Sri Lanka and in India, overseas slow bowlers have done marginally better than they have in Australia.
The overall averages for spinners are worse in South Africa and West Indies, but in both cases the lack of quality of the home spinners has been the biggest reason for the high averages: in both countries, the home spinners have conceded well over 40 runs per wicket, with the overseas bowlers doing significantly better.
| Host | Tests | Home spin - wkts | Average | Strike rate | Away spin - wkts | Average | Strike rate | Overall ave |
| South Africa | 56 | 109 | 43.05 | 83.3 | 194 | 38.04 | 74.4 | 39.84 |
| West Indies | 54 | 179 | 45.97 | 103.2 | 275 | 35.52 | 72.8 | 39.64 |
| Pakistan | 32 | 199 | 37.38 | 76.8 | 167 | 41.85 | 81.4 | 39.42 |
| Australia | 61 | 307 | 31.99 | 63.1 | 237 | 48.81 | 82.8 | 39.32 |
| New Zealand | 45 | 151 | 40.48 | 86.3 | 166 | 34.19 | 73.4 | 37.18 |
| India | 52 | 550 | 31.53 | 69.4 | 264 | 45.56 | 84.3 | 36.08 |
| England | 78 | 207 | 34.90 | 70.1 | 278 | 37.35 | 72.6 | 35.97 |
| Zimbabwe | 22 | 81 | 43.53 | 84.9 | 114 | 29.39 | 70.2 | 35.26 |
| Bangladesh | 33 | 205 | 44.56 | 88.4 | 270 | 22.51 | 46.6 | 32.02 |
| Sri Lanka | 57 | 586 | 24.74 | 59.2 | 284 | 45.84 | 86.9 | 31.38 |
Over the last decade, spinners from all teams have struggled in Australia, but those from England have found it tougher than most other sides. New Zealand's average is closest to the home team, but for all the others, it exceeds 40. Indian spinners have taken plenty of wickets in Australia - almost seven per match - but they've come at quite a cost.
England, though, have done even worse: over two five-Test series, their spinners have managed only 24 wickets, each costing more than 56. Not only have their spinners failed to take wickets, they've also failed to keep the runs under check, leaking 3.87 runs per over, which is again higher than all teams except Zimbabwe and Bangladesh.
Going back a little further and looking at the corresponding numbers since 1990, it turns out that England haven't done that much better, with only 63 wickets in 25 Tests at 49.66.
| Team | Tests | Wickets | Average | Strike rate | 5WI/ 10WM |
| Australia | 61 | 307 | 31.99 | 63.1 | 14/ 1 |
| New Zealand | 7 | 34 | 35.79 | 70.8 | 3/ 0 |
| Sri Lanka | 4 | 22 | 42.95 | 70.8 | 2/ 1 |
| India | 9 | 62 | 45.06 | 73.5 | 4/ 1 |
| South Africa | 9 | 26 | 50.57 | 84.4 | 0/ 0 |
| Pakistan | 6 | 28 | 52.25 | 84.1 | 3/ 0 |
| West Indies | 11 | 24 | 55.37 | 115.1 | 1/ 0 |
| England | 10 | 24 | 56.45 | 87.4 | 1/ 0 |
| Zimbabwe | 2 | 8 | 73.50 | 97.6 | 1/ 0 |
| Bangladesh | 2 | 3 | 98.00 | 138.6 | 0/ 0 |
And now here's a look at the individual bowlers during this period. Admittedly, it's a table which doesn't make for pretty viewing. Anil Kumble leads the wickets tally with 44 in eight games, but he has had to work pretty hard for his successes, conceding almost 35 runs per wicket. His strike rate's pretty good, but he has an unusually high economy rate of 3.62 runs per over. In fact, Kumble conceded more than three runs per over in every innings he bowled in Australia.
Vettori's economy rate is much better at 2.95, but his average is slightly higher, and the lack of too many other attacking options in New Zealand's bowling attack has hurt him too. Pakistan's Danish Kaneria is the second of three legspinners among the top four wicket-takers, but he too has had to work a lot for his wickets, conceding more than 40 runs per wicket and 3.80 runs per over. (Kaneria, though, can justifiably point to Kamran Akmal's contribution in pushing that average towards 40.) Upul Chandana has done better, thanks to his match haul of 10 for 210 in Cairns.
England's leading spinners on their last two tours to Australia have been left-armers, and Monty Panesar has clearly been the better of the two, with ten wickets at 37.90, but what's more surprising is the lack of success for the offspinners. Both Harbhajan Singh and Muttiah Muralitharan have had entirely forgettable series in Australia.
| Bowler | Tests | Wickets | Average | Strike rate | 5WI/ 10WM |
| Anil Kumble | 8 | 44 | 34.65 | 57.4 | 4/ 1 |
| Daniel Vettori | 8 | 29 | 37.55 | 76.2 | 3/ 0 |
| Danish Kaneria | 5 | 24 | 40.58 | 64.0 | 3/ 0 |
| Upul Chandana | 2 | 12 | 22.50 | 30.8 | 2/ 1 |
| Sulieman Benn | 3 | 11 | 37.09 | 83.4 | 1/ 0 |
| Paul Harris | 3 | 10 | 38.70 | 81.5 | 0/ 0 |
| Monty Panesar | 3 | 10 | 37.90 | 53.7 | 1/ 0 |
| Ashley Giles | 3 | 9 | 50.33 | 90.2 | 0/ 0 |
| Harbhajan Singh | 4 | 9 | 73.22 | 126.0 | 0/ 0 |
| Muttiah Muralitharan | 3 | 9 | 61.88 | 113.3 | 0/ 0 |
| Claude Henderson | 3 | 8 | 60.00 | 90.1 | 0/ 0 |
| Ray Price | 2 | 6 | 61.83 | 89.6 | 1/ 0 |
| Richard Dawson | 4 | 5 | 79.60 | 115.2 | 0/ 0 |
Even in the last 30 years, England's spinners have struggled to be incisive in Australia. As the table below shows, the leading wicket-takers since 1980 have all had a strike rate of more than 100 balls per wicket. Offspinner Geoff Miller has the best average, but he has only taken 13 wickets in five Tests.
| Bowler | Tests | Wickets | Average | Strike rate | 5WI/ 10WM |
| John Emburey | 6 | 19 | 43.05 | 121.2 | 2/ 0 |
| Phil Tufnell | 8 | 19 | 41.42 | 109.7 | 1/ 0 |
| Eddie Hemmings | 5 | 18 | 42.66 | 111.8 | 0/ 0 |
| Phil Edmonds | 5 | 15 | 35.86 | 104.6 | 0/ 0 |
| Geoff Miller | 5 | 13 | 30.53 | 78.9 | 0/ 0 |
| Peter Such | 2 | 11 | 29.36 | 63.7 | 1/ 0 |
| Monty Panesar | 3 | 10 | 37.90 | 53.7 | 1/ 0 |
| Ashley Giles | 3 | 9 | 50.33 | 90.2 | 0/ 0 |
| Richard Dawson | 4 | 5 | 79.60 | 115.2 | 0/ 0 |
However, there are quite a few reasons to believe that Swann stands a much better chance than his predecessors: England have a decent pace attack, and if the fast bowlers provide breakthroughs, Swann will have much better match situation to bowl in. More importantly, Australia's batting form has been so patchy that it's unlikely they'll take too many liberties against Swann. Both, the England team and their leading spinner will believe past record won't count for much when the battle begins in a couple of weeks.
S Rajesh is stats editor of Cricinfo