ODI overs analysis using ball-by-ball data: Part 1
An analysis using ball-by-ball data to identify scoring and wicket-taking patterns through the 50-over innings in ODIs
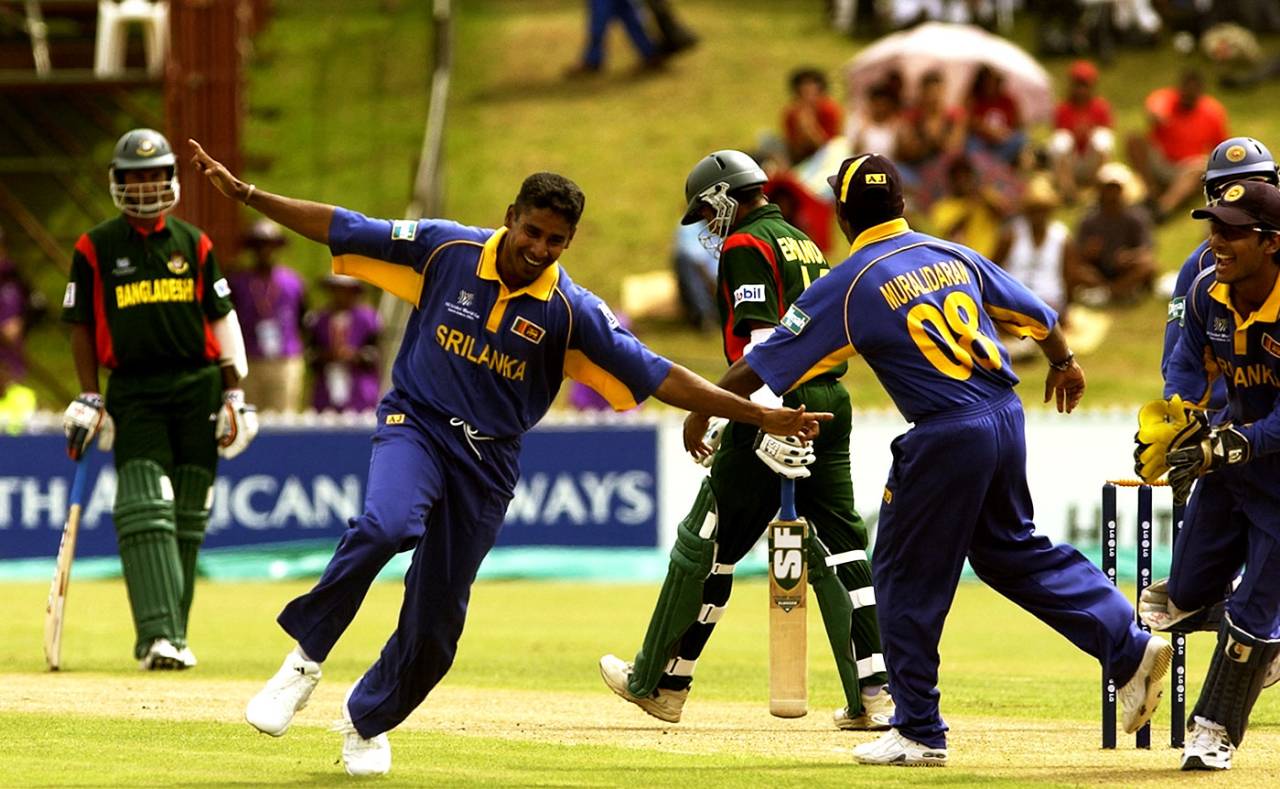
Chaminda Vaas' over against Bangladesh in the 2003 World Cup in which he took four wickets is possibly the best first over in ODI history • Shaun Botterill/Getty Images
I had earlier done a head-to-head analysis on ODI batsmen. This is the first part of a series of articles where I will take an anecdotal look at the overs and look at the over as a single entity. In the second (and possibly the third) part, I will look at over groups, possibly incorporating teams and periods. I will analyse bowlers later.
Redefinition of the dot ball and maiden over
I have made a very significant and common-sense based redefinition of one of the pillars of bowling analysis. Henceforth I will treat a dot ball as one in which no run was added to the opposing team. Thus a maiden over comprises of six such tougher-defined dot balls. I am sure most readers will agree with me. The current definition of dot ball and maiden over dating back to 1877, is outdated and archaic for the modern ODI game.A bowler should earn his maiden today. Already we have amendments to the law that do not allow wide and no-ball to be exempt while looking at dot balls and maiden overs. I have simply extended this concept to byes and leg byes. When Irfan Pathan bowled six balls to Ravi Bopara in Cuttack in 2008 and conceded eight leg byes, he, good bowler though he is, did not deserve a maiden. There is no denying that eight runs were accrued to the England total which is all that matters. This over should never be treated as a maiden.
The bottom line as far as I am concerned is that it is the runs conceded to the other team that matter, not the runs conceded to the batsmen. This is to emphasise the team game concept. I have talked about this in depth since I know that the point will be raised by readers. I will accept and post all such comments but will not change my interpretation.
First let us see some interesting overs bowled in ODIs. It is a pity that this cannot be done for the first half of the ODI matches but readers may jog their memory cells and come out with gems during the first 30 years or so.
A. 30+ run overs
1. Match# 2537/39: Daan van Bunge to Herschelle Gibbs. The sequence is a pure and perfect domination: "6 6 6 6 6 6". Nothing more needs to be said. Gibbs joins Garry Sobers, Ravi Shastri and Yuvraj Singh, and, on the flip side, van Bunge joins Malcolm Nash, Tilak Raj and Stuart Broad.2. Match# 3398/33: Robin Peterson to Thisara Perera. The unbelievable sequence was "6 1wd 6 6 6 4 6". A near-perfect over spoiled by the solitary wide, but still comes in second.
3. Match# 2584/39: Malinga Bandara bowled an all-boundary over to Shahid Afridi. The scorecard read "4 4 6 6 6 6". No wide to spoil the lovely sequence.
4. Match# 2619/50: Yuvraj Singh to Dmitri Mascarenhas. I have moved this up even though it is a 30-run over. The sequence is wonderful: "0 6 6 6 6 6". After a dot ball, Mascarenhas dispatched every ball over the ropes.
5. Match# 3421/47: Ishant Sharma to James Faulkner. This was not an all-boundary over but close to it with a series of even number runs. The sequence was "4 6 6 2 6 6".
6. Match #3123/49: Abdul Razzaq to Ross Taylor in the 2011 World Cup. The sequence was "4 6 1wd 6 1wd 2 4 6". It was amazing how he kept strike.
7. Match# 3129: Rizwan Cheema and Harvir Baidwan to James Franklin and Kane Williamson. This was a messy over. The sequence will reveal what happened. "1 6 6 4 6 5(4+1nb) 1wd 2". The fifth ball was a high full toss which meant Cheema was banned from bowling and Baidwan completed the over. Overall very sloppy work by the Canadians.
8. . Match# 2537/39: This was later in the Gibbs innings. van Troost (the other van) bowled to Kallis and Boucher. The sequence was "4 1 2 5wd 6 6 6".
B. 4-wicket overs
1. Match#2071/37: It will be tough to take this over off the "best last over" perch. Mohammad Sami bowled Jacob Oram and Tama Canning to start with. Then he bowled two dot balls to Daniel Vettori. He finished the over off by dismissing Vettori and Paul Hitchcock. Four wickets to Sami, and a maiden over to boot.2. Match#1950/1: Almost certainly the best first over in history. Chaminda Vaas dismissed Hannan Sarkar, Mohammad Ashraful and Ehsanul Haq to get a hat-trick off the first three balls. Then he conceded a four and a wide and dismissed Alok Kapali lbw. There was finally a dot ball to finish the over. Four wickets and five runs. These two overs are the only ones in which the bowlers have captured all four wickets.
3. Match# 3275/43: Thisara Perera bowled a fantastic over to finish off the match. A dot ball to Younis Khan started the proceedings. Then he dismissed Younis, Afridi and Sarfraz Ahmed to get a hat-trick. Then a dot ball was followed by a run-out of Sohail Tanvir. A maiden over, three wickets and a run-out: and all this against a top team like Pakistan. It is of interest to note that Perera is the only player to find an entry in both 30-plus runs and four-plus wickets lists.
4. Match#2054/50: This was also against a top team, Australia. Ajit Agarkar bowled Damien Martyn, conceded a single to Michael Clarke, dismissed Michael Bevan, bowled a wide, conceded a single to Clarke, and then Clarke was run out, and finally Andy Bichel was dismissed by Agarkar. Three wickets, one run-out and three runs.
5. Match# 1969/50: Andrew Caddick started the over typically. He bowled a dot ball, conceded two wides and then a single. But he finished the over strongly: dismissing Mohammad Kaif, Rahul Dravid and Javagal Srinath with a run-out in between.
6. Match# 2140/50: The unlikely Chris Gayle got three wickets and there was a run-out in this last over. Gayle dismissed Andrew Flintoff, Andrew Strauss and Paul Collingwood and then Geraint Jones was run out. It must be conceded that there was a double-century stand between Flintoff and Strauss before this over. Gayle followed this magnificent over with an equally majestic 132.
7. Match# 1963/43: Vasbert Drakes claimed two wickets and conceded five runs in this over to finish off Canada's innings, aided by two run-outs.
8. Match# 3136/50: This was an extraordinary over by Kevin O'Brien. Two dot balls and a wide to Atse Buurman set the tone. This was followed by four run-outs. So Netherlands moved from 305 for 6 to 306 for 9, without a single bowler wicket.
C. Innings last over maidens
First innings:1. Match# 1891: Allan Donald for South Africa against Bangladesh.
2. Match# 2017: Daryl Tuffey for New Zealand against Pakistan.
Second innings:
3. Match# 1790: Inzamam-ul-Haq (yes, you read it correctly) for Pakistan against Bangladesh. I watched this on television. It was the most hilarious five minutes of my life. Inzamam bowled (no, threw, at an estimated 60 degrees elbow bend!) six balls, dismissed Enamul Haque, and millions, including the 15 players on ground, were in splits. It was like Buster Keaton meeting Laurel, Hardy, Abbot, Costello, Chaplin and Nagesh.
4. Match # 2837: Ryan ten Doeschate for Netherlands against Bermuda.
5. Match# 3337: Narsingh Deonarine for West Indies against Zimbabwe.
D. Great last overs: Truly wonderful overs that almost certainly won the game for the bowling team
1. Match# 3080: Munaf Patel had only three runs available when the last over started against South Africa. A South African win seemed certain. Then Munaf bowled, almost unarguably, the best last over in ODI history. The sequence was "1 W 0 1 0 W". Two wickets and two runs meant that India won by one run.2. Match# 2913: Peter Siddle, against India, had eight runs available to defend. He bowled a wonderful last over conceding three and capturing one wicket, leaving Australia winners by four runs.
3. Match# 2923: Lightning struck a few days later in Hyderabad. Australia scored 350 but then Sachin Tendulkar played, arguably, his greatest ODI innings, of 175. He fell a few runs short of the target. Shane Watson had only seven runs to defend in the last over. He conceded four singles, and a run-out meant Australia won a match of 697 runs, by three runs.
4. Match# 3425: Morne Morkel had only two runs available. He bowled a great trio of deliveries: A single, followed by a dot ball and then a wicket, to give South Africa a one-run win over Pakistan.
5. Match# 3058: Rubel Hossain had only seven runs to play with. He conceded a four off the first ball. Then bowled a dot ball and bowled Kyle Mills to take Bangladesh to an unexpected three-run win over New Zealand.
6. Match# 2302: Australia's Mick Lewis who, unfortunately, sank without a trace in the 438-run bloodbath, started the last over against New Zealand with five runs to defend. Three runs were scored but two run-outs were effected and Australia won by two runs.
For those who would like to refer to Tendulkar's last over against South Africa in Calcutta, there is no ball data for that match (a single to Brian McMillan, and Fanie de Villiers was run out trying for the second run that wasn't there, three dot balls to Donald, a single to Donald then a single to McMillan).
I have departed from my normal way of structuring the article. Normally I produce tables, explain them, produce graphs and add closing description. This time I have decided to use only the graphs, which are self-explanatory. The tables are too long and are available for downloading and perusal.
The first graph is the analysis of average runs scored in each over. Remember that the data for each over data is the compilation of thousands of overs across matches.
Some very interesting points emerge from the graph. The average runs scored per over, across all 50 overs, is just a fraction either side of 5.0 for the first and second innings. This is because the additional runs scored in the first-innings wins by runs is offset by fewer overs required to chase successfully. The average number of overs per innings for the first innings is 47.1 and for the second innings, 40.4.
However, there is considerable variation across the overs in the two innings. In the first innings, the teams start slowly during the first 15 overs, consolidate and then move into higher gears in the last few overs. Obviously the real reason is that they do not know what targets are to be set. The first over has an average of only 3.23 runs per over. The last three overs are well above 8.0 and even cross 10.0 for the 50th over.
The second innings is planned in a better manner. The teams know what the targets are. They start in the second gear in the initial overs, consolidate and finish on a more even keel, at around seven runs per over at the end. It is of interest to note that no second innings over even exceeds 8.0 runs per over. The graph clearly shows the even distribution.
The runs per over in the first innings crosses 5.0 only in the 36th over while in the second innings 5.0 gets crossed as early as sixth over. Once 5.0 is crossed in the first innings it stays above this for the remaining 14 overs. In the second innings the runs-per-over value stays above 5.0 for 17 overs. The dip in the middle overs is deeper in the first innings than in the second innings.
The Standard Deviation (SD) for the two innings confirms this. The SD for the first innings is 1.334 and for the second innings, 0.833.
Is there anything that stands out? Possibly the clear increase in runs per over in the first innings, 40th over onwards, and the caution-induced plateau in scoring between overs 41 and 45 in the second innings. While I will be covering groups of overs in the second article, it is pertinent to point out that the slight increase in tempo of scoring around the third Powerplay in both innings.
Let us now come to the average number of wickets captured in each of the overs. The averages for each innings are almost identical: 0.166 vs 0.163. These figures will show a lot more variations when we incorporate teams and periods.
Let us make sense of these set of numbers. A wicket every 36 balls means an average of 0.167. The first-over average of 0.136 means a wicket every 44 balls. The 50th over average of 0.725 leads to a wicket every eight balls: understandable, since the batsmen are throwing their bats around.
This graph shows that there is a lot more similarity in the average wickets lost values between the two innings than the runs scored values. The graphs are almost identical barring the last over. In the first innings the desperation is shown in the 50th over. The average wickets lost jumps up by 50% to 0.725. In the second innings the value moves to 0.63.
There is a slight increase in the number of wickets lost in the second innings indicating a slightly more aggressive approach, borne out by the higher rate of scoring. In their anxiety to keep the scoring rate close to the target rate, the second batting teams seem to be taking some additional risks.
The SD for the two innings confirms the fact that there are fewer variations between innings. The SD for the first innings is 0.113 and for the second innings, 0.102. 10% for the wickets measure as against 35% in the runs measure.
Let me first remind the readers that these are the maidens, with team runs as the base and not maidens, with the bowler runs as the base. Unlike T20, where maidens are like gold dust, quite a few maidens are bowled in ODIs. When we have analyses like 10-8-3-4, 12-8-6-1, 10-5-5-1 and the like, it is certain that many maidens are bowled. But, with a caveat. Most of such accurate bowling was during the BBD (Before-Ball-Data) era. Maidens have come down during the past decade.
The number of maidens bowled does not convey much since the number of overs bowled between 1 and 50 varies considerably, especially in the second innings. Hence I have done this graph based on the percentage of maiden overs bowled. It is amazing that when all matches are considered the maidens percentage for the first innings is almost the same as that for the second innings: 5.1% against 5.0%.
For the first innings, the maiden percentage starts at a high 16% for the first over to 0.2% for the 50th over. That is a range of once in six overs to once in 500 overs. For the second innings, this varies between 12% to 1.2%. The last number on much lower number of overs. The two graphs seem to be reasonably similar.
There are some unexpected spurts: the third and ninth overs in the first innings. Maybe because the best bowler starts the bowling and bowls these overs. In the second innings, it is the third, fifth, seventh, ninth and for a strange reason, the 38th (34 in 37th to 55 in 38th to 36 in 39th). Why, I wonder. Maybe the teams tend to play it safe or the best bowler comes back during the Powerplay.
I am certain that the teams and period analysis will reveal many more insights. Looks like I have to do more than two articles.
This is the other end - the average percentage of overs in which 20 or more runs added to the team total. Common sense tells us that such occurrences are likely to occur more frequently in the first innings, which is an "unknown" innings as far as targets are concerned. The teams have to go for broke, especially in the later stages. In the second innings, the target is known and the teams could and would plan their innings, leading to a more even distribution of over runs.
Similar to maidens analysis, I will work on percentage of overs measure. Nice to see that our assumptions are correct. First the overall average. The average 20-plus overs for the first innings is 0.32% and that for the second innings is at 0.18%, a clear 45% lower. This was certainly as expected.
Unlike the first three measures, where the graphs followed a gradual increasing or decreasing pattern, this one is almost a random graph. Some incidence of such overs in the first 15 overs, almost dropping down to very small values, including zero during the middle overs and then an explosion into very high numbers in the first innings. In the second innings, the last phase changes to a spurt, not an explosion.
Incidentally, the values for overs 49 and 50 are way above 2.5. These have been capped for graphical display. The actual numbers are 2.73% and 4.66%. That means that once every 21 matches the last over crosses 20 runs.
The opening over in the first innings has never ever gone past 20 runs. Understandable indeed. This is followed by a few more occurrences of such zero incidence: Overs numbers 5, 7, 19, 21, 22, 24, 15 and 28. Again understandable since these are consolidation overs and teams do not break lose. For the second innings there are minor changes and fewer occurrences: Over numbers 20, 24, 28, 34 and, surprisingly, 44. When the target is near, the teams play it safe and if the target is unreachable, they play defensively.
In order to make it easier for the readers to peruse the data, I have converted the 50-over data for both innings to an Excel sheet and uploaded the same. Please click HERE to download/view the document.
In the second part I will group the overs into various blocks such as 1-10, 11-15, 15-25 and so on. This will enable us to derive some insights into the Powerplay behaviour. It is possible that I could bring in the teams and periods also. I will also go anecdotal on multiple-over outliers such as consecutive maiden overs et al.
Anantha Narayanan has written for ESPNcricinfo and CastrolCricket and worked with a number of companies on their cricket performance ratings-related systems