Unsettled Australia give New Zealand hope
History is completely in favour of the hosts but New Zealand will fancy their chances against an Australian team trying to cope with multiple injury worries
Madhusudhan Ramakrishnan
30-Nov-2011
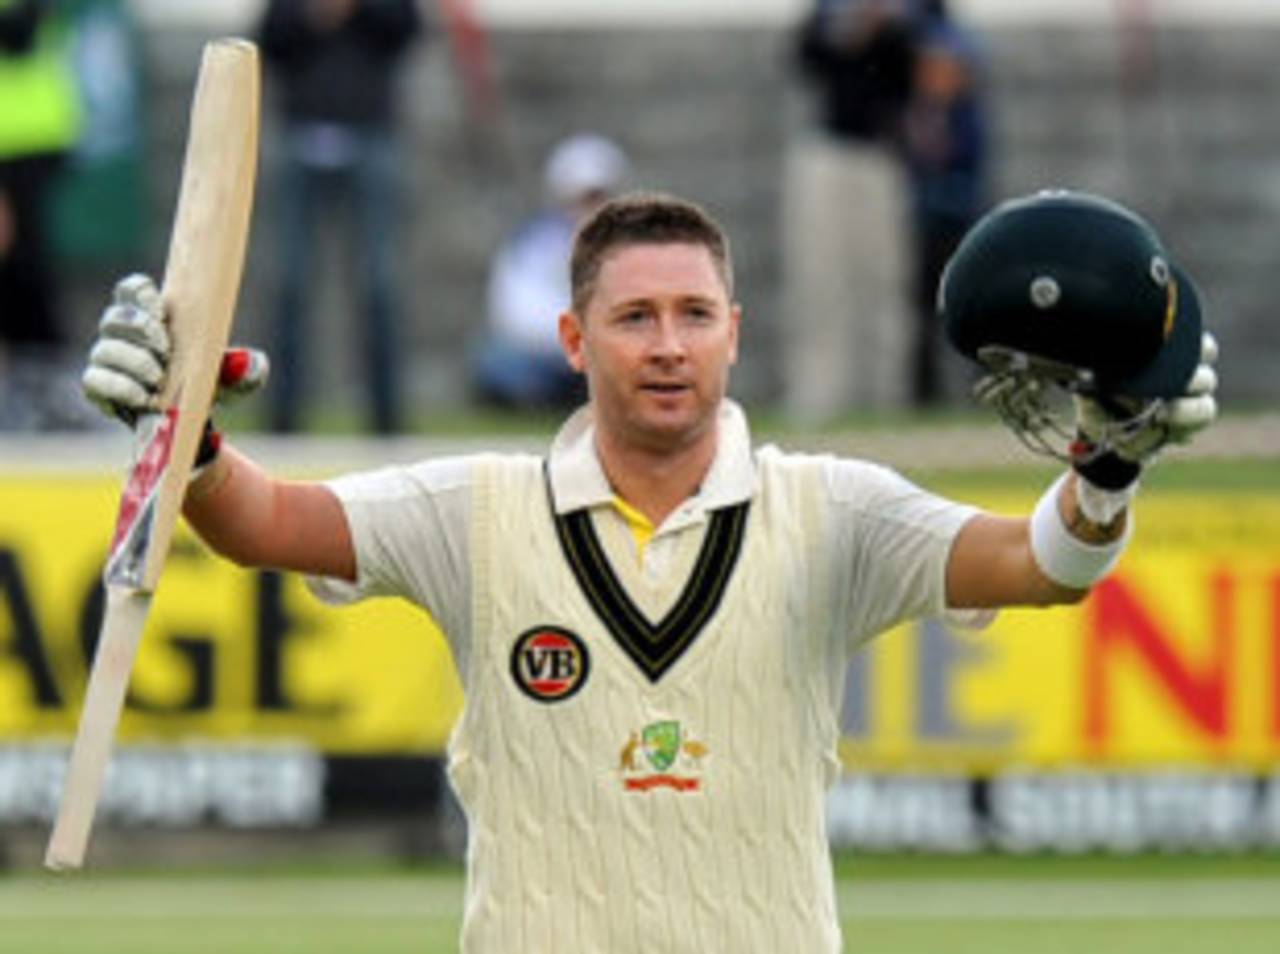
Michael Clarke has scored over 600 runs with three centuries in nine Tests against New Zealand • AFP
The Trans-Tasman rivalry, in contrast to many other famous ones in international cricket, has been extremely one-sided. Except for the mid 1980s, when Richard Hadlee's superlative bowling helped New Zealand win home and away series, Australia have been by far the more consistent and dominant team, winning 26 matches and losing just seven (win-loss ratio of 3.71). Stunningly, the last Test defeat for Australia against New Zealand came way back in the 1992-93 series in New Zealand. In Australia, it was 26 years, and 17 Tests ago.Since then, Australia have gone on to win 13 out of 18 matches. In 50 Tests played over between the two teams, Australia have a batting average of 38.94, compared to New Zealand's 27.07. The gulf is even wider in matches played in Australia, where the difference in averages is 14.40. Five of New Zealand's seven wins have come at home, and the last time New Zealand won a Test in Australia was way back in the 1985-86 season.
That was the period when Australia were on the wane following the retirements of most top players while New Zealand were in the middle of their best run. New Zealand won their first series in Australia in 1985-86 and went on to win two home series in the next four years. Statistically, this was the only phase that New Zealand matched and often bettered Australia. In the ten years between 1984 and 1994, both teams won five matches each and Australia were only slightly ahead on averages. However, since then, during an outstanding period of success, Australia have completely dominated New Zealand. The difference in averages between the teams has been a massive 19.55 in Tests since 2000, and 26.87 in the last four series. Although Australia have done well in their last two series in Sri Lanka and South Africa, New Zealand will fancy their chances of troubling the hosts, who are beset with multiple injury problems.
| Played | Australia | New Zealand | Drawn | W/L ratio | Australia (avg) | New Zealand (avg) | Avg diff | |
| Overall | 50 | 26 | 7 | 17 | 3.71 | 38.94 | 27.07 | 11.87 |
| In Australia | 26 | 14 | 2 | 10 | 7.00 | 41.69 | 27.29 | 14.40 |
| In New Zealand | 24 | 12 | 5 | 7 | 2.40 | 36.22 | 26.82 | 9.40 |
| 1980-1999 | 26 | 10 | 6 | 10 | 1.66 | 35.11 | 28.45 | 6.66 |
| 2000-2011 | 15 | 11 | 0 | 4 | - | 46.37 | 26.82 | 19.55 |
| Last four series | 9 | 8 | 0 | 1 | - | 51.54 | 24.67 | 26.87 |
A surprising stat is that New Zealand have played just 17 Tests since the beginning of 2009. This is far fewer than most teams have played in the same period. Australia have fallen from their perch but have still managed to maintain a fairly healthy win-loss ratio of 1.50, which is behind only those of England and India. While their batting average of 36.14 is fifth on the list, their bowling average (32.88) is second only to that of England. Their average difference of 3.34 is slightly better than India's (2.82) but lower than England (13.74) and South Africa (6.33).
New Zealand's position in the table is quite the opposite. They have a terribly low win-loss ratio of 0.37, which is only marginally better than West Indies' 0.25. Their only Test win against a major Test-playing nation came against Pakistan in 2009. New Zealand have a better batting average than Pakistan and West Indies but on the flip side, they also have a bowling average of 42.23. This has meant that their average difference (-9.80) is the second-lowest among top Test teams.
| Team | Played | Won | Lost | W/L ratio | Bat avg | Bowl avg | Avg diff |
| England | 36 | 20 | 5 | 4.00 | 44.49 | 30.75 | 13.74 |
| India | 31 | 14 | 7 | 2.00 | 40.52 | 37.70 | 2.82 |
| Australia | 31 | 15 | 10 | 1.50 | 36.14 | 32.88 | 3.34 |
| South Africa | 20 | 7 | 7 | 1.00 | 39.69 | 33.33 | 6.36 |
| Sri Lanka | 26 | 6 | 6 | 1.00 | 40.57 | 41.46 | -0.89 |
| Pakistan | 27 | 7 | 11 | 0.63 | 30.24 | 33.44 | -3.20 |
| New Zealand | 17 | 3 | 8 | 0.37 | 32.43 | 42.23 | -9.80 |
| West Indies | 28 | 3 | 12 | 0.25 | 29.76 | 39.90 | -10.14 |
Australia go into the first Test with a new opening pair following the injury to Shane Watson. Watson and Phillip Hughes shared a 174-run opening stand in the second Test in Johannesburg. This was the first century opening stand for Australia since the one between Simon Katich and Hughes against New Zealand in 2010. In the last two years, Ricky Ponting's poor form has meant that the partnership average for the second wicket has also fallen. New Zealand, on the other hand, have continuously had problems at the top of the order against major teams. Their average for the first two wickets (28.39 and 29.44) is well below par. While the fifth-wicket averages for both teams are very similar, the numbers for Australia are much better for the fourth and sixth wicket.
| Partnership wicket | Australia | New Zealand |
| 1 | 50.82, 7/20 | 28.39, 2/3 |
| 2 | 41.33, 7/8 | 29.44, 1/2 |
| 3 | 37.39, 4/13 | 36.29, 2/6 |
| 4 | 45.75, 7/11 | 32.44, 1/2 |
| 5 | 42.21, 6/9 | 42.48, 4/2 |
| 6 | 50.06, 5/15 | 38.92, 2/6 |
Michael Clarke, who took over the captaincy in Sri Lanka, has had a fairly successful start leading the side. He scored a fighting century in the final Test in Sri Lanka and followed it up with an outstanding 151 on a difficult pitch in Cape Town. He has also had tremendous success against New Zealand, scoring over 476 runs at an average of 79.33. Michael Hussey had a poor tour of South Africa, but has been Australia's stand-out batsman since the Ashes series. He, however, has struggled against New Zealand, scoring 198 runs at an average of 33.00 with just two fifties. Ponting has been fighting for runs recently, and has had his problems against New Zealand too, averaging only 28.16 in his last four Tests against them.
For New Zealand, Ross Taylor and Brendon McCullum have impressive stats against Australia, and will need to maintain that form for their team to do well. They also ave fine records in Tests over the last three years, averaging more than 45. Jesse Ryder, another vital player in New Zealand's batting line-up, averages over 42 since the beginning of 2009 but is yet to demonstrate any form in Tests against Australia.
| Batsman | Since January 2009 | v New Zealand (since 2006) |
| Ricky Ponting | 29, 35.76, 2/14 | 4, 28.16, 0/1 |
| Michael Clarke | 31, 43.88, 7/9 | 4, 79.33, 2/2 |
| Michael Hussey | 31, 44.98, 6/13 | 4, 33.00, 0/2 |
| Ross Taylor | 17, 48.74, 3/10 | 4, 45.75, 1/1 |
| Brendan McCullum | 17, 47.46, 4/7 | 4, 44.14, 1/2 |
| Jesse Ryder | 10, 42.61, 3/2 | 2, 17.50, 0/0 |
In the absence of Mitchell Johnson and the impressive Pat Cummins, Australia's attack could be tested. While Johnson has 24 wickets at 16.57 in four Tests against New Zealand, Cummins bowled with great pace and aggression in his debut game against South Africa in the recently-concluded series. Peter Siddle, who will play New Zealand for the first time, will lead the inexperienced pace attack.
New Zealand's pace line-up is likely to be led by Chris Martin and Tim Southee. Martin, one of only four New Zealand bowlers with 200-plus wickets in Tests, has barely troubled Australia in the past. In his last four Tests against Australia, he has picked up just seven wickets at an average of 68.71. Doug Bracewell had an excellent debut against Zimbabwe picking up a five-wicket haul in New Zealand's close 34-run win. Daniel Vettori is easily the most experienced bowler for them, but even he has fairly ordinary stats in Tests in Australia, averaging almost 40 per wicket.
Brisbane, the venue for the first Test, has been Australia's stronghold. They have not lost a single Test at the venue since their defeat against West Indies in 1988. Brisbane's bouncy conditions have generally favoured Australia's attack and the result percentage has been fairly high. However, in the recent Ashes series, the pitch at the Gabba was completely out of character as the match ended in a dull draw with England scoring over five hundred runs for the loss of just one wicket in their second innings. While the batting averages in the first and third innings in Brisbane have been high, the corresponding numbers for the second and fourth innings are much lower. Pace bowlers, who have 240 wickets at 34.29, have easily outperformed the spinners, who have just 64 wickets at 42.56.
Hobart, on the other hand, has played host to just four Tests since 2000. As in Brisbane, the batting averages are high in the first and third innings. The venue, however, has been a far more successful one for spinners, who have picked up 37 wickets at 37.91. In contrast, pace bowlers have struggled picking up 61 wickets at an average of 47.91.
| Venue | Matches | Result % | 1st inns | 2nd inns | 3rd inns | 4th inns | Pace (wickets,avg) | Spin(wickets,avg) |
| Brisbane | 11 | 73 | 42.78 | 31.59 | 40.95 | 25.18 | 240, 34.29 | 64, 42.56 |
| Hobart | 4 | 75 | 57.03 | 32.32 | 44.88 | 33.04 | 61, 47.14 | 37, 37.91 |