Australia's dominance overwhelming
The hosts have won 18 of the 29 triangular series but have lost the last two in the finals
Madhusudhan Ramakrishnan
03-Feb-2012
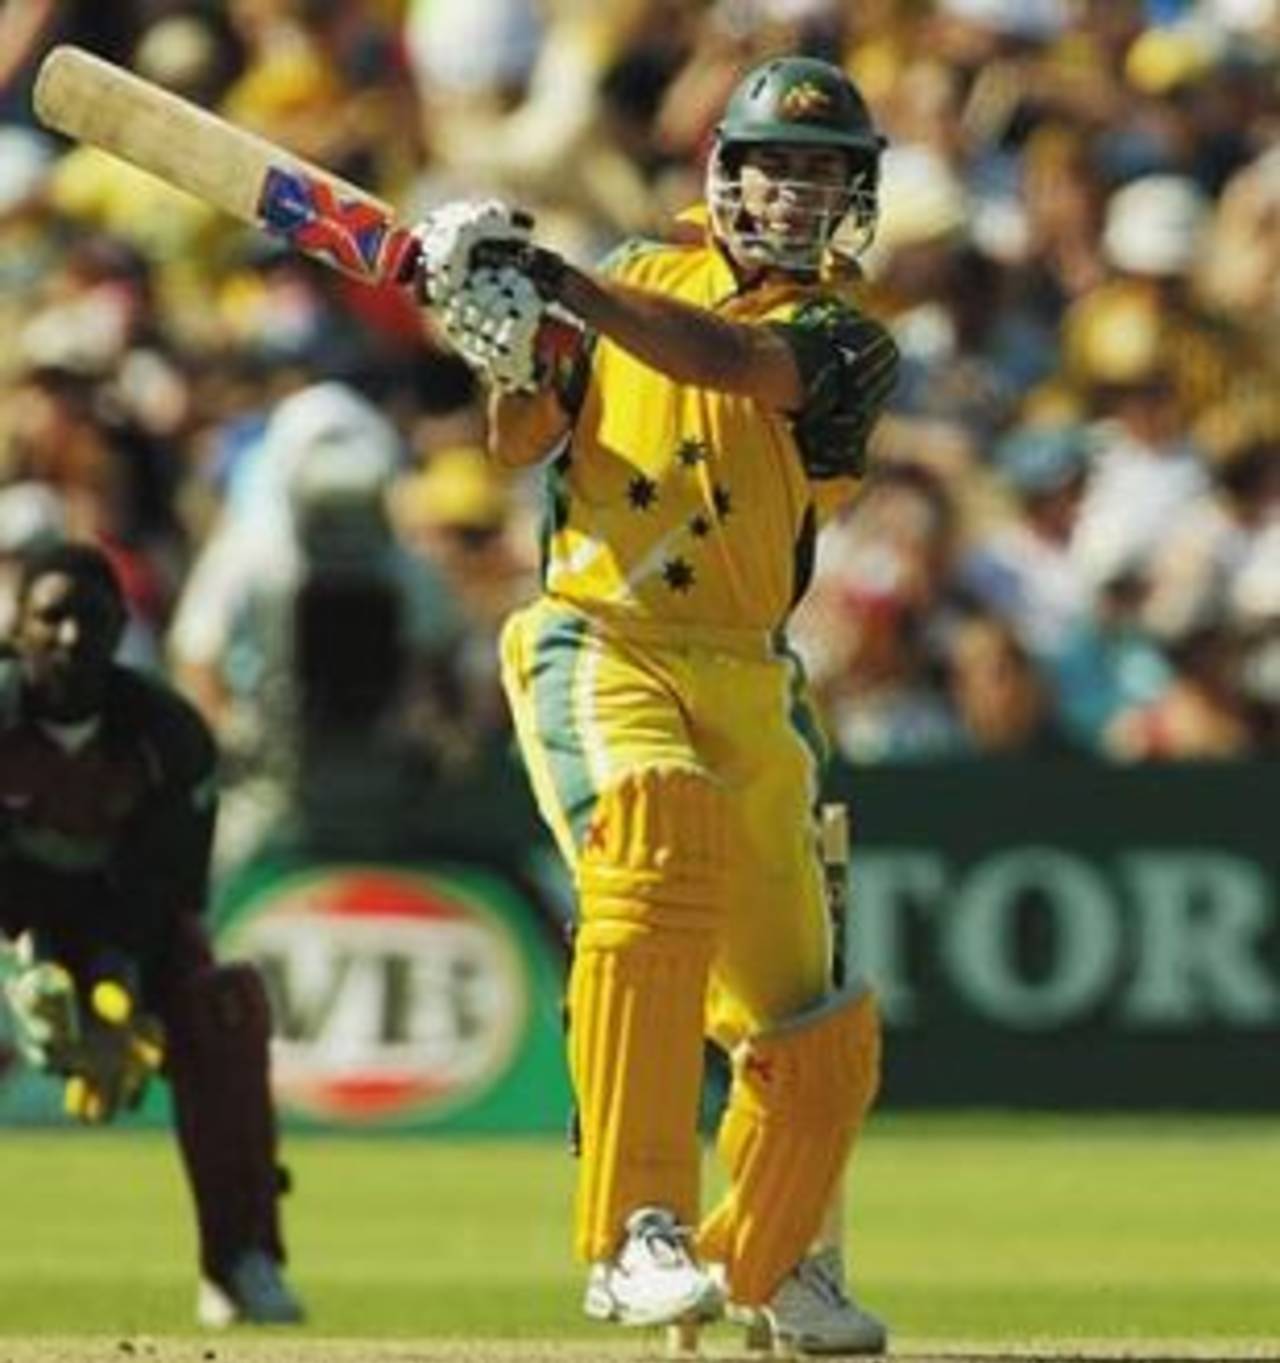
Michael Bevan's average of 57.11 is the highest among batsmen with 2000-plus runs in the triangular series • Hamish Blair/Getty Images
After two seasons of Kerry Packer's World Series Cricket, the idea of the triangular series took shape in 1979-80, with Australia, England and West Indies participating in the Benson and Hedges World Series Cup. The inaugural tournament also featured the first ever floodlit game, between Australia and West Indies in Sydney. Between then and 2007-08, the tri-series became an annual fixture and an important part of the Australian cricket season. Till the mid-1990s, Australia and West Indies dominated the competition, winning all but one tournament. Since the decline of West Indies as a cricketing force, Australia have hardly been threatened in the tri-series. Between 1997-98 and 2005-06, Australia failed to win in only one season, in 2001-02 when they finished behind South Africa and New Zealand. Surprisingly, in the last two seasons of the tri-series before the tournament was replaced by bilateral series for three seasons, Australia lost in the finals, to England in 2006-07, and India in 2007-08. That marked the first instance of them failing to win in consecutive home tri-series tournaments since 1983-84 and 1984-85.
Australia have figured in 300 matches in the tournament and have an impressive win-loss record over the years. West Indies were by far the best team in the 1980s and registered all their tournament wins (6) between its inception in 1979-80 and 1992-93. Their win-loss ratio between 1979 and 1989 was an outstanding 2.35 (47 wins and 20 losses) but it fell away rapidly through the 1990s and 2000s. In their heyday (the 1980s), West Indies had an average difference (difference between batting and bowling average) of 6.77, easily the best among all teams. Their run-rate difference (difference between batting run-rate and economy-rate) was also the highest (0.36). Overall, however, Australia have been the dominant side with corresponding numbers of 6.66 and 0.34 respectively. India and Sri Lanka, the two teams playing in this year's tournament, have played 60 and 73 matches so far in the tri-series respectively, with win-loss ratios of 0.62 and 0.33. India won the tournament in 2007-08, beating Australia in the first two finals while Sri Lanka made the finals in 2005-06 in which they lost to Australia.
| Team | Matches | Wins | Losses | W/L ratio | Bat avg/bowl avg | avg diff | RR/ER | RR diff |
| Australia | 300 | 191 | 100 | 1.91 | 31.74/25.08 | 6.66 | 4.66/4.32 | 0.34 |
| West Indies | 120 | 68 | 48 | 1.41 | 28.02/25.55 | 2.47 | 4.34/4.18 | 0.16 |
| South Africa | 39 | 21 | 18 | 1.16 | 28.60/26.23 | 2.37 | 4.44/4.53 | -0.09 |
| England | 73 | 32 | 41 | 0.78 | 26.19/29.85 | -3.66 | 4.42/4.54 | -0.12 |
| India | 60 | 22 | 35 | 0.62 | 26.08/29.97 | -3.89 | 4.36/4.60 | -0.28 |
| New Zealand | 89 | 33 | 54 | 0.61 | 25.35/29.35 | -4.00 | 4.26/4.47 | -0.21 |
| Pakistan | 74 | 26 | 46 | 0.56 | 24.76/29.84 | -5.08 | 4.25/4.52 | -0.27 |
| Sri Lanka | 73 | 18 | 54 | 0.33 | 25.09/39.36 | -14.27 | 4.48/5.01 | -0.53 |
The tournament usually features a long league phase and a best-of-three final, giving teams an opportunity to make comebacks. There have been cases when teams that struggled to qualify for the final have ended up winning the tournament. In 1993-94, Australia lost twice to South Africa in the group phase and again in the first final but went on to win the second and third finals. In 1996-97, West Indies beat Pakistan in three of four group games but lost in the first two finals against the same opponents. The hosts have a top-class record in the tri-series finals, winning 18 of the 25 they have featured in. West Indies won each of the first six finals they contested and lost two, in 1997 and 2001. Apart from South Africa, who have an even win-loss record in final matches (4-4), all other teams have lost more matches than they have managed to win. New Zealand have been very ordinary in finals, losing 11 matches and winning just one.
| Team | No of finals played | No of series won | Wins/Losses (in finals) |
| Australia | 25 | 18 | 38/21 |
| West Indies | 8 | 6 | 13/7 |
| England | 5 | 2 | 4/6 |
| South Africa | 3 | 1 | 4/4 |
| India | 4 | 1 | 2/6 |
| Pakistan | 4 | 1 | 2/6 |
| New Zealand | 5 | 0 | 1/11 |
| Sri Lanka | 2 | 0 | 1/4 |
Over the years, patterns in the tri-series have changed. In the first ten years (1979-89), teams batting first did not have any distinct advantage, winning 82 and losing 81 matches. There were very few 300-plus scores in the period (3) and the overall run-rate and runs per wicket were 4.28 and 27.21 respectively. In the 1990s, the win-loss record for teams batting first improved considerably (54.88% of matches) but the number of 300-plus scores did not increase by much (5). The scoring-rate and runs-per-wicket figures for the period came down from the corresponding numbers in the previous period. However, since 2000, the stats have been completely different. There have been 23 scores over 300 and teams batting first have won nearly 60% of their matches. The run-rates in the first and second innings (5.08 and 4.79) are considerably higher than the numbers in the previous two periods.
| Period | Matches * | % wins (batting first) | No of 300-plus scores | Runs per wicket (1st innings) | Run-rate (1st innings) | Runs per wicket (2nd innings) | Run-rate (2nd innings) | RPW/RR (Overall) |
| 1979-1989 | 167 | 49.10 | 3 | 27.20 | 4.37 | 27.23 | 4.18 | 27.21/4.28 |
| 1990-1999 | 133 | 54.88 | 5 | 26.99 | 4.29 | 25.94 | 4.17 | 26.49/4.24 |
| 2000 onwards | 124 | 58.87 | 23 | 32.03 | 5.08 | 28.71 | 4.79 | 30.44/4.95 |
| Overall | 424 | 53.77 | 31 | 28.54 | 4.55 | 27.25 | 4.35 | 27.93/4.46 |
The tracks in Australia have generally favoured pace bowlers, and this is evident in the bowling stats across the years in the tri-series. In the first ten years of the tri-series, pace bowlers had the better average (27.71) and strike-rate (42.01) as compared to the spinners. The fast bowlers also had a lower economy rate (3.95) as compared to that of the spinners (4.28). The difference in bowling average between pace bowlers and spinners dropped from 7.10 in the first ten years to 4.27 in the 1990s. The presence of Shane Warne meant that spinners also contributed a higher percentage of wickets in the 1990s as compared to the previous decade. Warne, who picked up 93 wickets at 21.04, was by far the best spinner in the tri-series matches in the 1990s. In the 2000s, the declining quality of spin meant that the average difference between pace and spin once again shot up to 8.58 and the spinners' percentage contribution to wickets also dropped. However, the economy-rates for pace bowlers and spinners were approximately equal, although much higher than the corresponding numbers in the 1990s.
| Period | Matches | Pace (wickets/ER, avg/SR) | Pace (4WI/5WI) | Spin (wickets/ER, avg/SR) | Spin (4WI/5WI) |
| 1979-1989 | 167 | 1757/3.95, 27.71/42.01 | 44/15 | 284/4.28, 34.81/48.78 | 6/1 |
| 1990-1999 | 133 | 1191/3.99, 28.84/43.30 | 30/12 | 443/4.34, 33.11/45.70 | 8/4 |
| 2000 onwards | 124 | 1214/4.80, 31.09/38.80 | 39/15 | 362/4.86, 39.67/48.90 | 11/1 |
| Overall | 424 | 4162/4.20, 29.02/41.40 | 113/42 | 1089/4.50, 35.74/47.60 | 25/6 |
Michael Bevan announced himself with a stunning 78 to help Australia win a last-gasp thriller against West Indies in Sydney in 1996. Bevan went on to become the most consistent batsman in the triangular series (min 2000 runs) with an average of 57.11. He scored only one century, a knock that gave Australia a win after they had virtually no hope of chasing 246 against New Zealand in 2002. Bevan proved to be even more prolific in finals, scoring over 400 runs at 66.83 with five half-centuries. Dean Jones, one of Australia's most successful ODI players, was also tremendous in the tri-series, averaging nearly 47. Viv Richards, perhaps the finest ODI player of his era, stood out among overseas batsman who played in the tri-series, averaging 46.60 overall and 53.25 in the finals. While Ricky Ponting is the highest run-getter in the history of the triangular series, Mark Waugh and Adam Gilchrist remain the only batsmen to score two centuries in finals.
| Batsman (overall) | Overall (Runs, average/SR) | Overall (100/50) | Batsman (finals) | Finals (Runs, average/SR) | Finals (100/50) |
| Michael Bevan | 2570, 57.11/72.43 | 1/18 | Michael Bevan | 401, 66.83/77.26 | 0/5 |
| Dean Jones | 3456, 46.70/70.31 | 2/28 | Matthew Hayden | 570, 57.00/76.10 | 1/5 |
| Viv Richards | 2563, 46.60/85.29 | 3/22 | Viv Richards | 639, 53.25/82.13 | 0/9 |
| Damien Martyn | 2090, 42.65/78.24 | 3/10 | Gordon Greenidge | 408. 51.00/60.17 | 0/4 |
| Ricky Ponting | 4030, 39.90/79.51 | 9/25 | Dean Jones | 921, 48.47/71.11 | 0/8 |
| Mark Waugh | 3618, 37.29/74.30 | 8/21 | Andrew Symonds | 475, 47.50/96.15 | 1/2 |
| Desmond Haynes | 2782, 37.09/59.50 | 4/21 | Ricky Ponting | 434, 28.93/61.04 | 0/3 |
| Adam Gilchrist | 3375, 36.29/97.88 | 8/14 | Graeme Wood | 517, 39.76/58.55 | 0/4 |
Stats highlights from the triangular series
- The highest team total in the triangular series is 368, by Australia against Sri Lanka in the second final in Sydney in 2005-06. Four of the top five scores have been made in Sydney.
- Mark Waugh holds the record for the highest individual score in the history of the tri-series, with 173 against West Indies in Melbourne in 2001. Of the seven batsmen who have scored over 150, four did so playing for Australia.
- Ajit Agarkar's 6 for 42 against Australia in Melbourne in 2003-04 is the best bowling performance in the tri-series. While Glenn McGrath has the most wickets, Brett Lee has the highest number of five-fors.
- The record partnership in the triangular series is 237 which has been achieved by Marvan Atapattu and Sanath Jayasuriya in Sydney in 2002-03 and also by Ponting and Andrew Symonds in 2005-06.