The Warner effect, and Johnson v Steyn
A look at the key aspects that ensured a 2-1 series result for Australia in South Africa
S Rajesh
07-Mar-2014
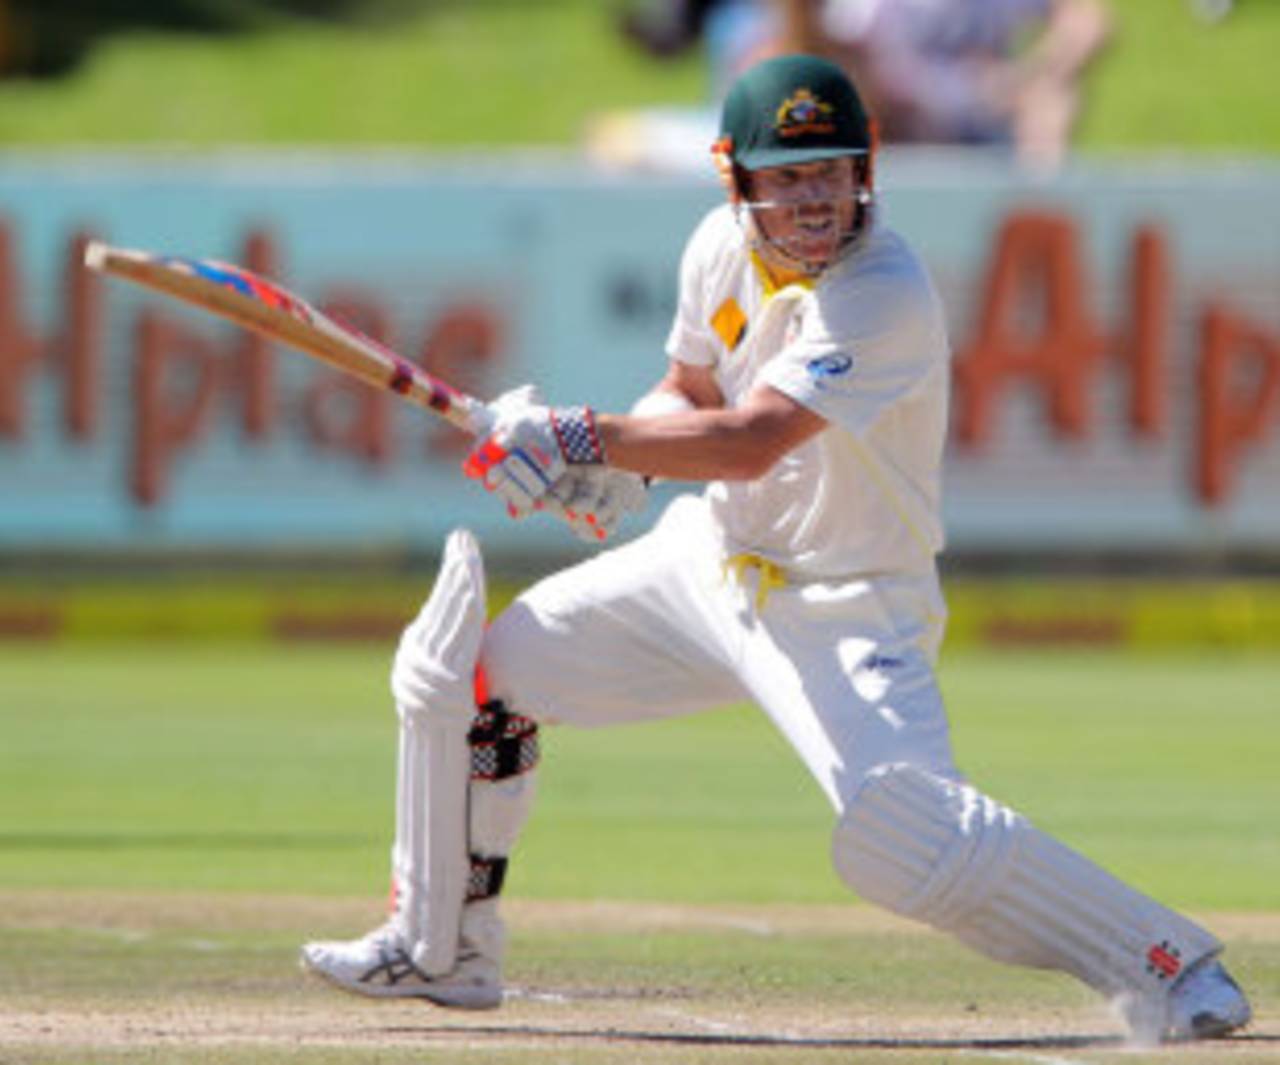
David Warner was involved in eight of the ten highest partnerships for Australia in the series, plus he scored 117 runs from 94 balls off Dale Steyn • Getty Images
It was billed as the clash of the top two teams in Test cricket, and the three Tests largely lived up to the hype. The pitches didn't always behave the way they were expected to, with Port Elizabeth and Cape Town both making the bowlers toil extremely hard for wickets, but the bowling quality of both sides ensured that in each Test there was one team that was able to overcome the conditions and force a result.
In the end, South Africa were only 27 balls from ensuring a drawn series, but the overall numbers for the series clearly show that Australia were the better team. They scored more runs and hundreds, took more wickets, and forced the pace of the game more often than the hosts did. South Africa were terribly unlucky with fitness issues, especially those relating to their premier fast bowler, but Australia overcame the disadvantage of playing overseas, and ultimately showed plenty of resilience to seal the series victory, and with it the No. 2 ranking in Tests.
Here are some of the key factors that turned out to be the difference between the two teams.
David Warner
This series was expected to be an extremely tough one for batsmen - especially openers - with each team boasting a fine array of fast bowlers, in conditions which were expected to assist them. Three of the four openers who played more than one Test at the top of the order averaged less than 31 in the series: Chris Rogers scored a fine century in Port Elizabeth but scored only 74 in his other five innings; Alviro Petersen aggregated 65 from four innings, while Graeme Smith had a forgettable farewell series, eking out 45 runs from six innings.
This series was expected to be an extremely tough one for batsmen - especially openers - with each team boasting a fine array of fast bowlers, in conditions which were expected to assist them. Three of the four openers who played more than one Test at the top of the order averaged less than 31 in the series: Chris Rogers scored a fine century in Port Elizabeth but scored only 74 in his other five innings; Alviro Petersen aggregated 65 from four innings, while Graeme Smith had a forgettable farewell series, eking out 45 runs from six innings.
In the midst of all this, David Warner had one of the finest three-Test series ever by an Australian opener, scoring 543 runs at 90.50, with three centuries, including one in the first innings of the Cape Town Test. Only Matthew Hayden, who made 549 in India in 2000-01, has made more in a three-match series for Australia. Admittedly he had some luck, but he made it count, and was almost always fluent, assured and aggressive at the crease. His strike rate of 86.74 further ensured that when he was making runs, he was always getting them quickly, which moved the game forward and put South Africa on the defensive.
Both teams had a couple of middle-order batsmen who stood firm and averaged more than 50 - AB de Villiers and Hashim Amla for South Africa, Steven Smith and Michael Clarke for Australia - while there wasn't too much difference between the lower orders either. Thus, Warner was largely the reason why Australia's average runs per wicket was about 12 more than South Africa's.
| Team | Runs scored | Wkts lost | Bat ave | Run rate | 100s/ 50s |
| Australia | 1946 | 46 | 42.30 | 3.81 | 7/ 4 |
| South Africa | 1651 | 55 | 30.01 | 2.98 | 3/ 6 |
| Australia | South Africa | |||||
| Runs | Average | 100s/ 50s | Runs | Average | 100s/ 50s | |
| Openers | 724 | 60.33 | 4/ 2 | 209 | 17.41 | 0/ 2 |
| Nos. 3-7 | 965 | 40.20 | 3/ 2 | 1066 | 38.07 | 3/ 3 |
| Nos. 8-11 | 150 | 15.00 | 0/ 0 | 274 | 18.26 | 0/ 1 |
Warner's presence at the top of the order also had a large hand to play in ensuring that Australia's average partnership for the top two wickets were 56 and 69, with six partnerships exceeding 50. Of the ten highest partnerships for Australia in the series, eight involved Warner, which indicates just how influential he was to Australia's batting display.
For South Africa, on the other hand, the top two wickets averaged about 11 runs per partnership, which means on average the team was two down for about 22. The partnerships for the first wicket read thus: 11, 6, 10, 20, 7, 12; and for the second wicket: 4, 6, 1, 22, 35, 0. South Africa's average stand for the first two wickets was 11.16, the second-lowest ever in their Test history (with a cut-off of ten partnerships) and the lowest in more than 100 years - their worst was in 1912, when the first two wickets averaged 10.33 per partnership in England. The middle order, led by de Villiers and Amla, helped resurrect the innings, but the difference in partnership runs for the top two wickets was a key factor, which again highlights Warner's role in the series.
| Australia | South Africa | |||||
| Wicket | Inngs | Ave stand | 100/ 50 p'ships | Inngs | Ave stand | 100/ 50 p'ships |
| 1 | 6 | 56.16 | 2/ 1 | 6 | 11.00 | 0/ 0 |
| 2 | 6 | 68.67 | 1/ 2 | 6 | 11.33 | 0/ 0 |
| 3 | 6 | 37.00 | 0/ 2 | 6 | 47.16 | 1/ 2 |
| 4 | 6 | 52.00 | 1/ 0 | 6 | 43.33 | 0/ 3 |
| 5 | 5 | 72.00 | 1/ 1 | 6 | 36.67 | 0/ 2 |
| 6 | 5 | 16.25 | 0/ 0 | 6 | 54.00 | 1/ 0 |
| 7 | 4 | 21.75 | 0/ 0 | 5 | 37.20 | 0/ 1 |
| 8 | 4 | 32.33 | 0/ 0 | 5 | 35.80 | 0/ 1 |
| 9 | 3 | 3.00 | 0/ 0 | 5 | 16.40 | 0/ 0 |
| 10 | 2 | 15.00 | 0/ 0 | 5 | 7.40 | 0/ 0 |
The pace contest
This series was always going to be a battle between the two pace attacks, and while South Africa had the better of the exchanges in Port Elizabeth, Australia won the overall contest: their fast bowlers averaged 27.42, while South Africa's conceded almost 42 runs per wicket. The difference in averages wasn't as much between the spinners of the two teams, but Australia's slow bowlers - led by Nathan Lyon - certainly gave the captain more control, going at only 2.59 per over, while South Africa's slow bowlers conceded almost four per over.
This series was always going to be a battle between the two pace attacks, and while South Africa had the better of the exchanges in Port Elizabeth, Australia won the overall contest: their fast bowlers averaged 27.42, while South Africa's conceded almost 42 runs per wicket. The difference in averages wasn't as much between the spinners of the two teams, but Australia's slow bowlers - led by Nathan Lyon - certainly gave the captain more control, going at only 2.59 per over, while South Africa's slow bowlers conceded almost four per over.
| Wickets | Average | Strike rate | Econ rate | |
| Aus pace | 42 | 27.42 | 55.48 | 2.96 |
| SA pace | 32 | 41.84 | 69.84 | 3.59 |
| Aus spin | 11 | 38.90 | 89.91 | 2.59 |
| SA spin | 12 | 45.00 | 69.08 | 3.90 |
After the Centurion Test, there was a suggestion from Smith that Johnson tended to be more effective against the tail than against top-order batsmen, but in this series Johnson took plenty of top-order wickets too - 17 of them, at 17.47.
| Wickets | Average | Strike rate | Econ rate | |
| Mitchell Johnson | 22 | 17.36 | 34.4 | 3.02 |
| Dale Steyn | 12 | 26.41 | 44.7 | 3.54 |
| Johnson v SA top 7 | 17 | 17.47 | 35.8 | 2.93 |
| Steyn v Aus top 7 | 9 | 30.00 | 52.2 | 3.44 |
Johnson was dominant against several South African batsmen in this series. He dismissed de Villiers and Smith four times each, with Smith being out four times in just 13 balls. Petersen fell three times scoring 15 runs off him. The only South African batsman who fared well against Johnson was Amla, who scored 63 off 128 balls and was dismissed once.
Steyn was dominant against Clarke and Haddin - though he didn't bowl much to them - but was clearly second best against the best batsman of the series: Warner scored 117 runs off Steyn at well over a run a ball, and was dismissed once.
| Batsman | Runs | Balls | Dismissals | Average |
| AB de Villiers | 77 | 154 | 4 | 19.25 |
| Graeme Smith | 17 | 13 | 4 | 4.25 |
| Alviro Petersen | 15 | 47 | 3 | 5.00 |
| Hashim Amla | 63 | 128 | 1 | 63.00 |
| Batsman | Runs | Balls | Dismissals | Average |
| Michael Clarke | 7 | 12 | 2 | 3.50 |
| Brad Haddin | 1 | 17 | 2 | 0.50 |
| Chris Rogers | 49 | 98 | 2 | 24.50 |
| David Warner | 117 | 94 | 1 | 117.00 |
The support act
Apart from Johnson trumping Steyn, what also influenced the series result were the stats of the other fast bowlers in the two line-ups. Ryan Harris was well below par in the first two Tests, while Peter Siddle was dropped after taking five wickets in two Tests, but Harris played a key role in Cape Town, taking seven wickets in the match. Vernon Philander and Morne Morkel, on the other hand, managed only a combined haul of 13 wickets in three Tests. Morkel bowled better than his figures of 6 for 381 suggest, but his inability to mix the fierce short stuff with the pitched-up deliveries meant batsmen were struck plenty of body blows off his bowling, but he didn't actually pick up too many wickets.
Apart from Johnson trumping Steyn, what also influenced the series result were the stats of the other fast bowlers in the two line-ups. Ryan Harris was well below par in the first two Tests, while Peter Siddle was dropped after taking five wickets in two Tests, but Harris played a key role in Cape Town, taking seven wickets in the match. Vernon Philander and Morne Morkel, on the other hand, managed only a combined haul of 13 wickets in three Tests. Morkel bowled better than his figures of 6 for 381 suggest, but his inability to mix the fierce short stuff with the pitched-up deliveries meant batsmen were struck plenty of body blows off his bowling, but he didn't actually pick up too many wickets.
Philander had his first poor home series too as a bowler, though he was more than handy with the bat and actually finished with the highest batting average among South African batsmen. Before this series, he had taken 62 wickets in ten home Tests at an average of 15.24 and an economy rate of 2.70; here, his seven wickets cost him 51.71 each, at an economy rate of 3.70 - he offered neither wicket-taking penetration, nor control over runs conceded. Australia's fast bowlers offered more control even when they weren't taking wickets. As mentioned earlier, injuries at key moments severely hampered South Africa, but Australia were good enough to take advantage of those injuries, and eventually seal the series.
| Wickets | Average | Strike rate | Econ rate | |
| Harris+Siddle+Pattinson | 19 | 38.42 | 77.05 | 2.99 |
| Philander+Morkel | 13 | 57.15 | 93.00 | 3.68 |
S Rajesh is stats editor of ESPNcricinfo. Follow him on Twitter