Why Australia can't catch a break in Asia
Between 2002 and 2006, they were a superb Test side in Asia, but over the last few years they have struggled to play spin and bowl spin in the continent
S Rajesh
12-Aug-2016
Australia had an outstanding record in Asia between 2002 and 2006, but since then it has been all downhill • ESPNcricinfo Ltd
"Australia", "spin", and "Asia" are terms that haven't gotten along well together, especially over the last decade. There was a period between 2002 and 2006 when they had a stunning record in Asia, winning ten out of 12 Tests: they blanked Pakistan and Sri Lanka 3-0, beat India 2-1 and Bangladesh 2-0. Shane Warne was in peak form during this period, taking an incredible 78 wickets from 11 Tests in Asia, while the batting line-up included Damien Martyn, Matthew Hayden, Ricky Ponting, Adam Gilchrist and Darren Lehmann - batsmen who could cope with the spin challenge thrown at them.
Since then, though, Asian tours have largely been unfulfilled campaigns for Australia. The one bright spot was in 2011, when they defeated Sri Lanka 1-0, but they have lost eight of ten Tests in India, two out of two in the UAE against Pakistan, and two out two here in Sri Lanka.
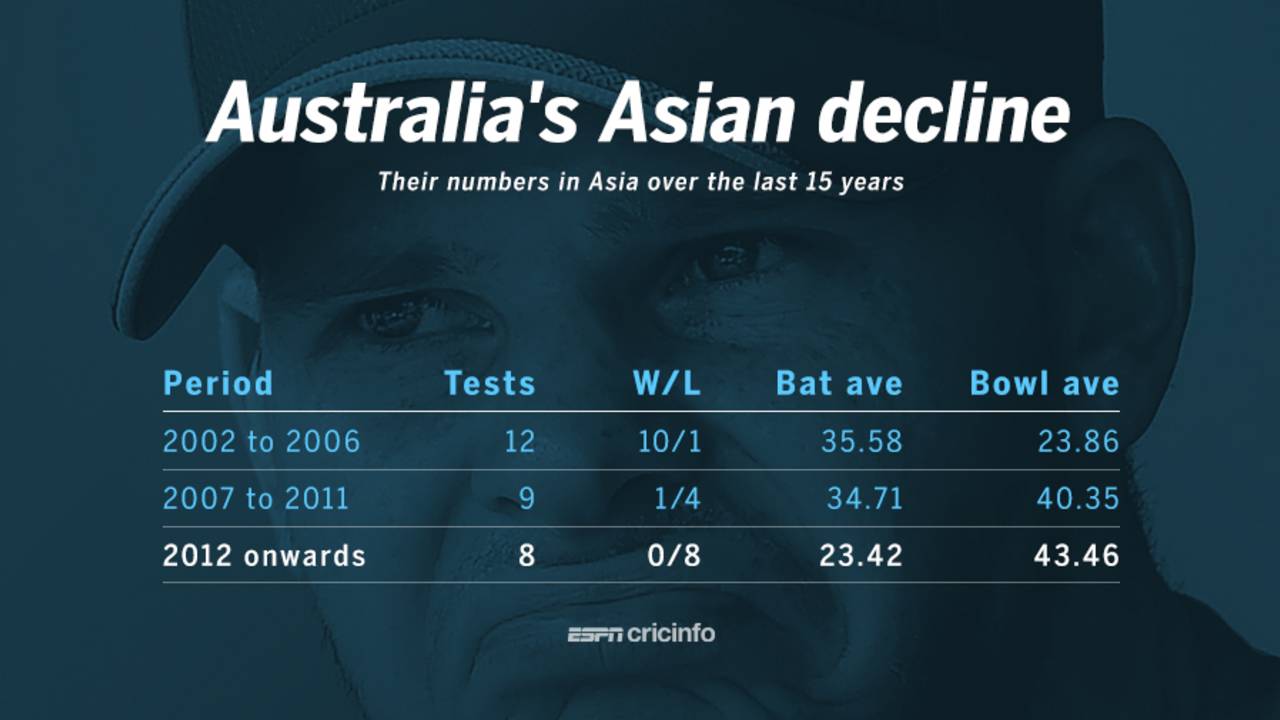
In the period between 2002 and 2006, what stands out is the Australian bowling average in Asia. Much has been written, quite justifiably, about the Australian batsmen's inability to cope with the turning ball lately, but the problem has also been the lack of incisiveness of the bowling unit to hunt as a pack and consistently take wickets and control the game in the field. Between 2002 and 2006, Australia had all their bowling bases covered - Warne was in top form and took care of the spin department, while Glenn McGrath and Jason Gillespie were outstanding fast bowlers even in the subcontinent. In that period, the Australian bowlers averaged 23.86 runs per wicket; since then it has gone up to more than 40, while the batting numbers have been especially poor in the last eight Tests.
| Period | Tests | W/ L | Bat ave | Bowl ave |
| 2002 to 2006 | 12 | 10/ 1 | 35.58 | 23.86 |
| 2007 to 2011 | 9 | 1/ 4 | 34.71 | 40.35 |
| 2012 onwards | 8 | 0/ 8 | 23.42 | 43.46 |
A further break-up of the bowling numbers indicates the fall for both pace and spin, but the difference is especially stark for the spinners. From an average of 21.24 during the Warne days, it has ballooned to around 50 over the last decade, a decline of more than 100%. Apart from the drop in average, the spinners have also been increasingly ineffective at controlling the game. Their economy rates over the three periods have risen from 3.18 to 3.71 to 4.16 (in the last eight Tests in Asia). That lack of control has forced the captain to rely more on the quick bowlers, thus decreasing their wicket-taking potency as well.
A comparison of the spin stats with the other top non-Asian teams shows that Australia and New Zealand have been the two sides whose spinners have especially struggled for wickets. However, while New Zealand's spinners averaged 50.80, they have at least been able to exercise some control over the game, going at 3.44 per over. Australia's spinners have leaked 4.16 runs per over while averaging nearly 50. Despite such unimpressive numbers, Australia's spinners have bowled 47% of the team's overs in Asia since 2012, which means they have surrendered control to the home batsmen for large periods; in low-scoring games those periods have often been decisive.
| Pace | Spin | |||||
| Wickets | Average | Strike Rate | Wickets | Average | Strike Rate | |
| 2002 to 2006 | 106 | 24.39 | 54.0 | 117 | 21.24 | 40.0 |
| 2007 to 2011 | 96 | 35.88 | 74.6 | 36 | 51.05 | 82.5 |
| 2012 onwards | 58 | 35.50 | 71.3 | 51 | 49.41 | 71.2 |
| Team | Wickets | Average | Econ rate |
| South Africa | 65 | 32.38 | 3.23 |
| England | 107 | 33.17 | 2.94 |
| West Indies | 44 | 37.72 | 3.48 |
| Australia | 51 | 49.41 | 4.16 |
| New Zealand | 45 | 50.80 | 3.39 |
Nathan Lyon, Australia's main spinner during this period, has been candid enough to admit that he hasn't yet mastered the art of bowling in Asia, where overspin isn't as effective as on bouncier pitches of Australia and South Africa. In fact, Lyon's overseas average outside of Asia is extremely impressive, and his economy rate of 2.88 indicates his control over proceedings.
In Asia, though, his average is almost 45 and his economy rate close to four an over. Among the 35 non-Asian spinners who have bowled at least 250 overs in Asia, only three have a poorer average than Lyon's 44.42. His strike rate of 68.4 is ninth among these 35 bowlers, but his economy rate is the poorest, which pushes his average to 32nd.
| Bowler | Tests | Wkts | Average | Econ | SR |
| David O'Sullivan | 6 | 13 | 61.84 | 2.57 | 144.2 |
| Carl Hooper | 21 | 23 | 59.34 | 2.69 | 132.0 |
| John Bracewell | 8 | 18 | 44.61 | 3.07 | 86.9 |
| Nathan Lyon | 10 | 35 | 44.42 | 3.89 | 68.4 |
| Jeetan Patel | 9 | 26 | 44.26 | 3.39 | 78.3 |
| Pat Symcox | 9 | 18 | 43.72 | 3.03 | 86.5 |
The batting against spin has obviously been a problem in Australia's last three series in Asia, which is reflected in the overall averages dropping from the mid-30s to 23.42. Against spin, Australia have averaged 20.56 in these last three series, poorer than all non-Asian teams except South Africa, since the start of 2012. They have also lost a greater percentage of wickets to spin than any other team.
It's clear that all non-Asian teams have struggled against spin in Asia in these last five years, with no team averaging more than 28, but England, New Zealand and West Indies have still done about 30% better than Australia. Add that to better displays by their spinners, and it's clear why some of those teams have had more success than Australia during this period.
| Team | Dismissals | Average | % wkts to spin |
| West Indies | 69 | 27.72 | 69.70 |
| New Zealand | 114 | 27.42 | 75.50 |
| England | 155 | 26.98 | 77.50 |
| Australia | 131 | 20.56 | 84.00 |
| South Africa | 113 | 20.46 | 80.14 |
Australia's batting problems in Asia are reflected in the stats of their two main batsmen in the continent. David Warner and Steven Smith have been prolific at home, averaging more than 60. Smith averages nearly 60 in overseas Tests excluding Asia, with centuries in England, New Zealand, South Africa and the West Indies. However, he is still searching for his first Test century in Asia, where his average drops to less than 38.
Warner's overseas numbers excluding Asia aren't quite as impressive as Smith's, but the average is still a reasonable 41.38, with three hundreds in South Africa. However, in Asia, his average drops to 32.37, with only one hundred in 16 innings.
With a four-Test series in India coming up next year, Australia have plenty to do if they are to avoid the embarrassment of 2013.
| Region | Tests | Runs | Average | 100s |
| Home | 27 | 2665 | 60.56 | 12 |
| Away (excl Asia) | 18 | 1407 | 41.38 | 3 |
| Asia | 8 | 518 | 32.37 | 1 |
| Region | Tests | Runs | Average | 100s |
| Home | 18 | 1750 | 67.3 | 8 |
| Away (excl Asia) | 19 | 1767 | 58.90 | 6 |
| Asia | 6 | 455 | 37.91 | 0 |
S Rajesh is stats editor of ESPNcricinfo. Follow him on Twitter