Williamson's drive to convert potential to performance
The break-up of his numbers indicates a preference for subcontinent conditions over those which support pace, seam and swing
S Rajesh
11-Oct-2013
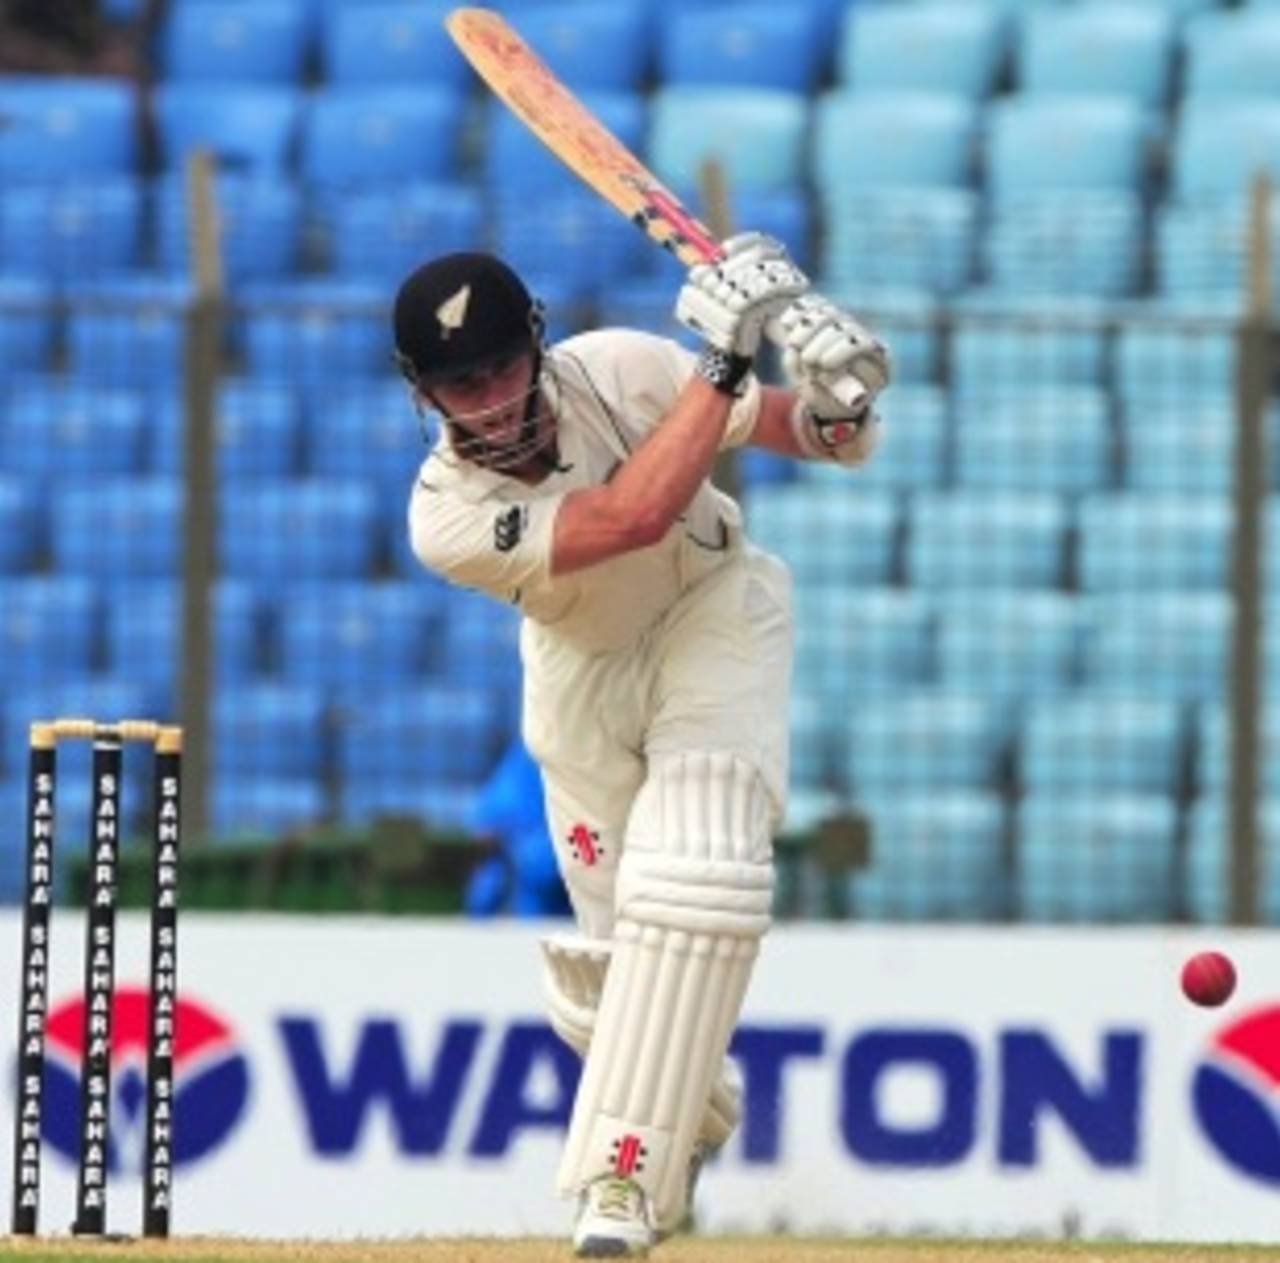
Kane Williamson averages 43.25 in Tests in Asia, but in Australia, England and South Africa, he averages 16.41 from 12 innings • AFP
From the moment he made his international debut - and perhaps even before that - Kane Williamson has been regarded as the next big thing in New Zealand batting. Anyone who has seen him bat will notice the classy strokeplay and elegance which has resulted in such expectations, and while the overall numbers so far don't justify all the hype, he has also shown more than once that he possesses both the skill and the temperament to live up to those expectations.
Traditionally, New Zealand haven't had an array of batting riches at their command, and given that their current line-up looks pretty thin as well, they'll want Williamson to develop into a significant player. So far, despite this latest century in Bangladesh, he hasn't consistently given New Zealand the sort of runs they'd expect from a top-notch No. 3.
In the 47 Test innings he has played, Williamson's average is a less-than-impressive 33.31. At No. 3, the average is almost the same - 33.51 from 28 innings.
The break-up of his numbers indicates a preference for subcontinent conditions over those which support pace, seam and swing. In eight Tests in Asia, Williamson has already struck three hundreds - one each in India, Sri Lanka and Bangladesh - and averages 43.07. That's better even that his home average of 41; his only home century, though, was a memorable one - 102 not out in Wellington against a potent South African attack, which helped New Zealand save the Test.
Williamson's problem so far, though, has been scoring runs in Australia, South Africa and England: he has only played two Tests in each of those countries, but he has collectively scored only 197 in those 12 innings, with only one half-century. Undoubtedly, though, he'll get plenty of opportunities to improve on those stats in the future.
| Tests | Runs | Average | 100s/ 50s | |
| In New Zealand | 9 | 533 | 41.00 | 1/ 4 |
| in Asia | 8 | 603 | 43.07 | 3/ 2 |
| in Aus, Eng, SA | 6 | 197 | 16.41 | 0/ 1 |
| Career | 26 | 1499 | 33.31 | 4/ 8 |
The table below lists the stats for some of New Zealand's top batsmen after 26 Tests. Andrew Jones leads the way with an average of 51.70, with Glenn Turner and Mark Richardson also averaging 50 or thereabouts. All the batsmen in the list below have higher averages than Williamson's 33.31, but the key name that he'll want to look at is just above him: Martin Crowe, after 26 matches, averaged 34.68, with three centuries from 43 innings; Williamson has four from 47.
Crowe, though, had a wretched start to his Test career, averaging 24.08 after 16 Tests. Thereafter, the improvement was dramatic. For Williamson to finish with top-class numbers, he'll have to similarly raise his game, though his career is likely to be last much longer than 77 Tests, which was the length of Crowe's career.
| Batsman | Innings | Runs | Average | 100s/ 50s |
| Andrew Jones | 48 | 2120 | 51.70 | 6/ 7 |
| Glenn Turner | 47 | 2083 | 50.80 | 5/ 10 |
| Mark Richardson | 44 | 2024 | 49.36 | 3/ 16 |
| Bert Sutcliffe | 47 | 2047 | 47.60 | 4/ 11 |
| Ross Taylor | 47 | 1997 | 43.41 | 5/ 10 |
| Stephen Fleming | 45 | 1588 | 36.93 | 1/ 12 |
| Martin Crowe | 43 | 1422 | 34.68 | 3/ 5 |
| Kane Williamson | 47 | 1499 | 33.31 | 4/ 8 |
Despite these numbers, Williamson is already among the top eight run-getters at the No. 3 slot for New Zealand, and isn't far from completing 1000 runs at that position. The average, though, remains lower than most of the others in the list below.
| Batsman | Innings | Runs | Average | 100s/ 50s |
| Stephen Fleming | 69 | 2977 | 47.25 | 6/ 12 |
| Andrew Jones | 70 | 2732 | 43.36 | 6/ 11 |
| Bevan Congdon | 62 | 2414 | 43.10 | 6/ 16 |
| Geoff Howarth | 33 | 1148 | 35.87 | 4/ 2 |
| John Reid | 24 | 1147 | 54.61 | 5/ 2 |
| Mathew Sinclair | 33 | 1113 | 37.10 | 3/ 1 |
| Kane Williamson | 28 | 905 | 33.51 | 2/ 5 |
| Barry Sinclair | 25 | 817 | 32.68 | 2/ 3 |
Williamson's numbers in Asia, and in Australia, South Africa and England, suggest his preference for spin over pace, and that's confirmed by the table below, which shows his stats against pace and spin. Against slow bowling he averages 43.25, but against pace it drops to less than 30.
The bowler who has dismissed him most often is a spinner, though: Pragyan Ojha has got him out five times conceding 92 (average 18.40). Against most other spinners, Williamson has come out on top, averaging 64 versus Monty Panesar, 50 against Rangana Herath and 44 against R Ashwin.
The quick bowlers have overall had more success against him, which suggests that his technique against pace might need some fine-tuning.
| Bowling type | Runs | Balls | Dismissals | Average |
| Pace | 802 | 2084 | 27 | 29.70 |
| Spin | 692 | 1555 | 16 | 43.25 |
A keeper who can score runs
While New Zealand have high hopes from Williamson to shoulder much of their batting responsibilities, they seem to have discovered a fine wicketkeeper-batsman in BJ Watling. Watling has played 15 Tests in all and averages 33.04, which isn't far away from Williamson's Test average. However, the additional responsibility of keeping wicket seems to have helped him focus on his batting too. In the eight Tests when he has kept wicket, Watling has scored 502 runs at an average of 45.63, with two centuries and three fifties; in Tests in which he has played as a specialist batsman, Watling averages 21.50, with only one half-century from 14 innings. Watling's aggregate of 502 is already the sixth best among New Zealand's wicketkeepers. The average, so far at least, is well clear of the others in the list. While both his centuries have come against Zimbabwe and Bangladesh, he has also scored vital 60s in the home series against South Africa. If he can keep this scoring rate going a little longer, and against all opposition, New Zealand's lower-order batting will look a lot stronger.
While New Zealand have high hopes from Williamson to shoulder much of their batting responsibilities, they seem to have discovered a fine wicketkeeper-batsman in BJ Watling. Watling has played 15 Tests in all and averages 33.04, which isn't far away from Williamson's Test average. However, the additional responsibility of keeping wicket seems to have helped him focus on his batting too. In the eight Tests when he has kept wicket, Watling has scored 502 runs at an average of 45.63, with two centuries and three fifties; in Tests in which he has played as a specialist batsman, Watling averages 21.50, with only one half-century from 14 innings. Watling's aggregate of 502 is already the sixth best among New Zealand's wicketkeepers. The average, so far at least, is well clear of the others in the list. While both his centuries have come against Zimbabwe and Bangladesh, he has also scored vital 60s in the home series against South Africa. If he can keep this scoring rate going a little longer, and against all opposition, New Zealand's lower-order batting will look a lot stronger.
| Player | Tests | Runs | Average | 100s/ 50s |
| Brendon McCullum | 52 | 2803 | 34.18 | 5/ 15 |
| Adam Parore | 67 | 2479 | 26.94 | 2/ 11 |
| Ian Smith | 63 | 1815 | 25.56 | 2/ 6 |
| Ken Wadsworth | 33 | 1010 | 21.48 | 0/ 5 |
| Warren Lees | 21 | 778 | 23.57 | 1/ 1 |
| BJ Watling | 8 | 502 | 45.63 | 2/ 3 |
S Rajesh is stats editor of ESPNcricinfo. Follow him on Twitter