Sean Williams is the only new entrant
An analysis of performances in the World Cup after the first three weeks of the World Cup
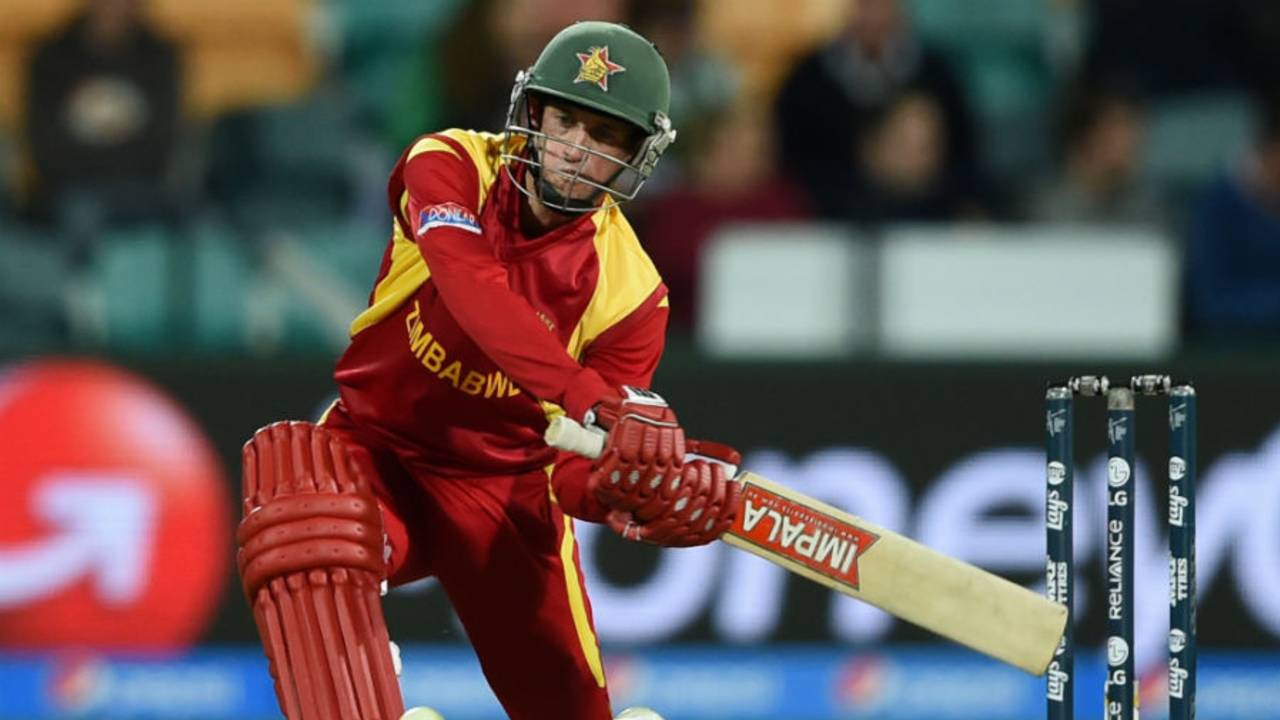
Sean Williams' 3 for 72 and 96 against Ireland was worthy enough to be placed sixth in the allrounders' list • AFP
This analysis will be done at suitable points during the World Cup 2015 so that the readers can see the way the Performance tables evolve. As more matches get played the top performance mosaic changes and readers can identify with what happened in the past few days. The qualifying bar for inclusion moves higher as more matches get played.
India defeated West Indies in a match in which both teams batted poorly, bowled very well, fielded awfully and finished strongly. The more experienced captain got India over the line but a thought should be spared for the young beleaguered West Indian captain. The Pakistan team which turned up on the ground was the determined one. Maybe South Africa needs these jolts in the early rounds to help them get over the line in the knockout rounds. I am beginning to doubt the cricketing intelligence of those who advocate the 10-team World Cup. A single nail-biter like the Ireland-Zimbabwe tie today is worth four meaningless matches between top teams.
| SNo | Rating Pts | Year | ODI# | Batsman | For | Vs | Runs | Balls |
|---|---|---|---|---|---|---|---|---|
| 1 | 579 | 2015 | 3616 | AB de Villiers | South Africa | Win | 162* | 66 |
| 2 | 573 | 2015 | 3612 | CH Gayle | West Indies | Zim | 215 | 147 |
| 3 | 460 | 2015 | 3615 | TM Dilshan | Sri Lanka | Bng | 161* | 146 |
| 4 | 460 | 2015 | 3610 | S Dhawan | India | Saf | 137 | 146 |
| 5 | 448 | 2015 | 3623 | DA Warner | Australia | Afg | 178 | 133 |
| 6 | 442 | 2015 | 3624 | KJ Coetzer | Scotland | Bng | 156 | 134 |
| 7 | 397 | 2015 | 3601 | DA Miller | South Africa | Zim | 138* | 92 |
| 8 | 389 | 2015 | 3613 | Shaiman Anwar | U.A.E. | Ire | 106 | 83 |
| 9 | 386 | 2015 | 3600 | JWA Taylor | England | Aus | 98* | 90 |
| 10 | 382 | 2015 | 3621 | HM Amla | South Africa | Ire | 159 | 128 |
The first two matches were bowling wins. There was very little top class batting. Both AB de Villiers' and Holder's fifties ended on the losing side. And the hundreds and nineties in the Hobart match were down valued because well over 650 runs were scored on the day. For the record, Brendan Taylor's 100 led amongst these four innings, with 325 rating pts. So there is no change to the batting performance table.
| SNo | Rating Pts | Year | ODI# | Bowler | For | Vs | Analysis |
|---|---|---|---|---|---|---|---|
| 1 | 670 | 2015 | 3617 | MA Starc | Australia | Nzl | 9.0 - 0 - 28 - 6 |
| 2 | 603 | 2015 | 3607 | TG Southee | New Zealand | Eng | 9.0 - 0 - 33 - 7 |
| 3 | 487 | 2015 | 3617 | TA Boult | New Zealand | Aus | 10.0 - 3 - 27 - 5 |
| 4 | 444 | 2015 | 3600 | MR Marsh | Australia | Eng | 9.0 - 0 - 33 - 5 |
| 5 | 428 | 2015 | 3602 | Sohail Khan | Pakistan | Ind | 10.0 - 0 - 55 - 5 |
| 6 | 356 | 2015 | 3616 | Imran Tahir | South Africa | Win | 10.0 - 2 - 45 - 5 |
| 7 | 349 | 2015 | 3620 | Mohammad Irfan | Pakistan | Zim | 10.0 - 2 - 30 - 4 |
| 8 | 324 | 2015 | 3608 | JE Taylor | West Indies | Pak | 7.0 - 1 - 15 - 3 |
| 9 | 318 | 2015 | 3621 | KJ Abbott | South Africa | Ire | 8.0 - 0 - 21 - 4 |
| 10 | 307 | 2015 | 3600 | ST Finn | England | Aus | 10.0 - 0 - 71 - 5 |
In all the matches the wickets were shared across many bowlers. Probably the best bowling performance was Alex Cusack's 4 for 32. It secured 278 rating pts, well below the cut-off.
| SNo | Rating Pts | Year | ODI# | Player | For | Vs | Runs | Balls | Analysis |
|---|---|---|---|---|---|---|---|---|---|
| 1 | 700 | 2015 | 3612 | CH Gayle | West Indies | Zim | 215 | 147 | 6.0-0-35-2 |
| 2 | 579 | 2015 | 3615 | TM Dilshan | Sri Lanka | Bng | 161* | 146 | 8.0-0-35-2 |
| 3 | 496 | 2015 | 3600 | MR Marsh | Australia | Eng | 23 | 20 | 9.0-0-33-5 |
| 4 | 446 | 2015 | 3620 | Wahab Riaz | Pakistan | Zim | 54* | 46 | 9.4-1-45-4 |
| 5 | 435 | 2015 | 3611 | MM Ali | England | Sco | 128 | 107 | 10.0-0-47-2 |
| 6 | 403 | 2015 | 3627 | SC Williams | Zimbabwe | Ire | 96 | 83 | 9.0-0-72-3 |
| 7 | 353 | 2015 | 3608 | AD Russell | West Indies | Pak | 42* | 13 | 8.0-2-33-3 |
| 8 | 300 | 2015 | 3614 | RD Berrington | Scotland | Afg | 25 | 46 | 10.0-0-40-4 |
| 9 | 299 | 2015 | 3606 | SC Williams | Zimbabwe | Uae | 76* | 65 | 8.0-0-43-2 |
| 10 | 298 | 2015 | 3613 | Amjad Javed | U.A.E. | Ire | 42 | 35 | 10.0-0-60-3 |
There was one entry into the player performance table. Sean Williams who followed up his 3 for 72 with an excellent 96, secured 403 rating points and moved into the sixth place.
| SNo | Rating Pts | Year | ODI# | Team | Own score | Vs | Other score |
|---|---|---|---|---|---|---|---|
| 1 | 721 | 2015 | 3616 | South Africa | 408 for 5 in 50.0 | Win | 151 for 10 in 33.1 |
| 2 | 714 | 2015 | 3607 | New Zealand | 125 for 2 in 12.2 | Eng | 123 for 10 in 33.2 |
| 3 | 691 | 2015 | 3610 | India | 307 for 7 in 50.0 | Saf | 177 for 10 in 40.2 |
| 4 | 688 | 2015 | 3623 | Australia | 417 for 6 in 50.0 | Afg | 142 for 10 in 37.3 |
| 5 | 678 | 2015 | 3621 | South Africa | 411 for 4 in 50.0 | Ire | 210 for 10 in 45.0 |
| 6 | 666 | 2015 | 3608 | West Indies | 310 for 6 in 50.0 | Pak | 160 for 10 in 39.0 |
| 7 | 665 | 2015 | 3618 | India | 104 for 1 in 18.5 | Uae | 102 for 10 in 31.3 |
| 8 | 645 | 2015 | 3619 | Sri Lanka | 312 for 1 in 47.2 | Eng | 309 for 6 in 50.0 |
| 9 | 640 | 2015 | 3605 | Bangladesh | 267 for 10 in 50.0 | Afg | 162 for 10 in 42.5 |
| 10 | 626 | 2015 | 3615 | Sri Lanka | 332 for 1 in 50.0 | Bng | 240 for 10 in 47.0 |
Pakistan's comfortable 29 run win fetched them a reasonable 619 rating pts but fell short of the cut-off. So the team performance table also remains static.
A brief introduction into the methodology of Performance Analysis.
The Batting Performance Ratings analysis takes into account the Runs scored, Balls faced, Next highest score (if this is the highest score), % of Team score, Innings status at entry, Bowling quality, Pitch information, Team strengths, Target score in front, Match location, Result and Match importance. These parameters are given appropriate weights. The calculations are done in such a way that Rating points of 1000 would be allotted to a mind-blowing and match-winning score of 200 in 150 balls in a WC final.
The Bowling Performance Ratings analysis takes into account the Wickets captured, Quality of batsmen dismissed, Scores at which batsmen were dismissed, Bowling accuracy, Batting quality, Pitch information, Team strengths, Target being defended, Match location, Result and Match importance. The calculations are done in such a way that Rating points of 1000 would be allotted to a magnificent and match-winning analysis of 10-2-15-6 in a WC final.
The Player Performance Ratings analysis takes into account the Batting Rating points, Bowling Rating points and the Fielding Rating points, which is a combination of catches and stumpings. There are minimum criteria for batting and bowling stints to ensure that these are genuinely all-round performances.
The Team Performance Ratings analysis takes into account the Result, Margin of win, Resources utilized, Team strengths, Match location and Match importance. The calculations are done in such a way that Rating points of 1000 would be allotted to an overwhelming win by 150 runs or 8 wickets in a WC final.
Anantha Narayanan has written for ESPNcricinfo and CastrolCricket and worked with a number of companies on their cricket performance ratings-related systems