Wahab Riaz enters the top allrounders' list, at No. 4
An analysis of performances in the World Cup after the first 23 matches of the World Cup
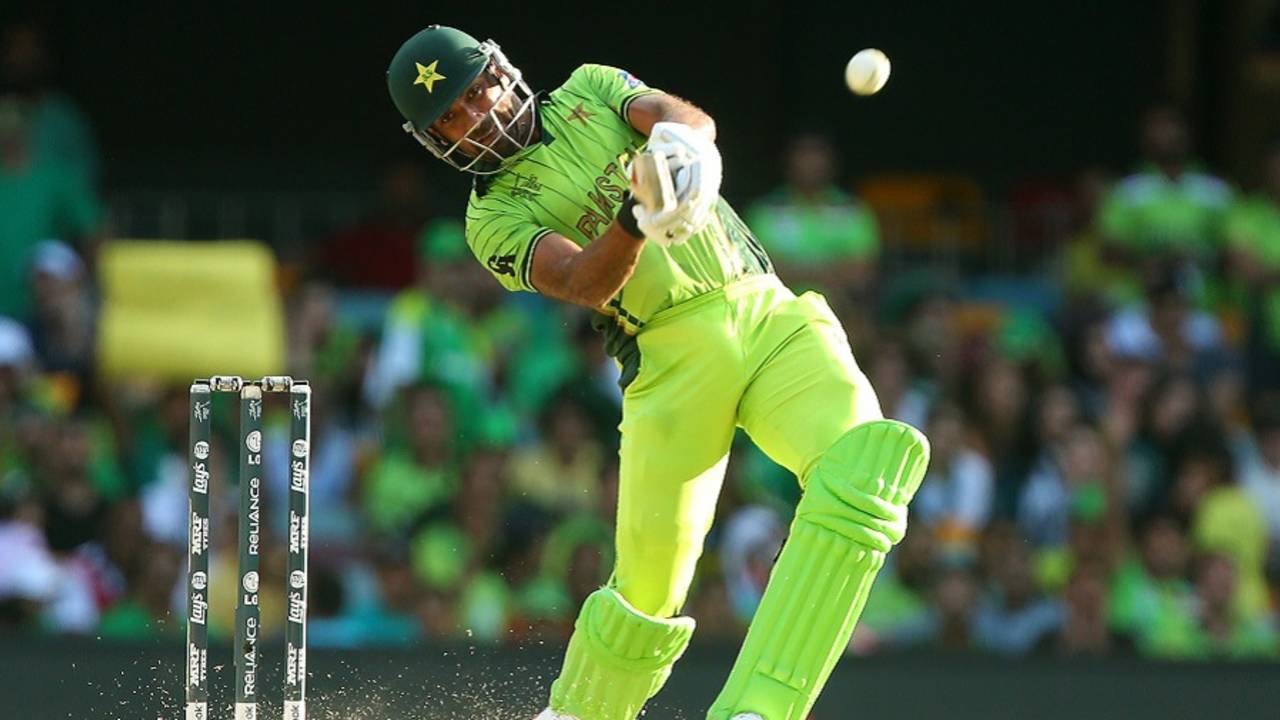
Wahab Riaz's all-round performance against Zimbabwe - the first time a Pakistan player hit a fifty and taken a four-for in a World Cup match - earned him a spot in the top allrounders list. • Getty Images
This analysis will be done at suitable points during the World Cup 2015 so that the readers can see the way the Performance tables evolve. As more matches get played the top performance mosaic changes and readers can identify with what happened in the past few days. The qualifying bar for inclusion moves higher as more matches get played.
An unexpected blanking out of the England team by Sri Lanka was followed by Pakistan's hard-fought win over Zimbabwe. These matches cleared the situation for the lower half teams as to what they had to do to qualify. It seems that only Ireland has real chances of qualifying, despite the big defeat against South Africa. Bangladesh might have some chances, only because of the single point earned from the washout.
| SNo | Rating Pts | Year | ODI# | Batsman | For | Vs | Runs | Balls |
|---|---|---|---|---|---|---|---|---|
| 1 | 579 | 2015 | 3616 | AB de Villiers | South Africa | Win | 162* | 66 |
| 2 | 572 | 2015 | 3612 | CH Gayle | West Indies | Zim | 215 | 147 |
| 3 | 460 | 2015 | 3615 | TM Dilshan | Sri Lanka | Bng | 161* | 146 |
| 4 | 460 | 2015 | 3610 | S Dhawan | India | Saf | 137 | 146 |
| 5 | 396 | 2015 | 3601 | DA Miller | South Africa | Zim | 138* | 92 |
| 6 | 389 | 2015 | 3613 | Shaiman Anwar | U.A.E. | Ire | 106 | 83 |
| 7 | 386 | 2015 | 3600 | JWA Taylor | England | Aus | 98* | 90 |
| 8 | 382 | 2015 | 3621 | HM Amla | South Africa | Ire | 159 | 128 |
| 9 | 370 | 2015 | 3600 | AJ Finch | Australia | Eng | 135 | 128 |
| 10 | 363 | 2015 | 3607 | BB McCullum | New Zealand | Eng | 77 | 25 |
Despite three centuries in the England-Sri Lanka match, there was no significant change to the Batting performance table. All these hundreds were rated just below the 351 points earned by Samiullah Shenwari. A match aggregate of 620 for 7 certainly indicates an out-and-out batting pitch. Just as I thought that Shenwari's fifty would stay on, Hashim Amla's huge and quick hundred got enough rating pts, 382 to be exact, to push this out. By now it will be clear that fifties have to be very special to qualify.
| SNo | Rating Pts | Year | ODI# | Bowler | For | Vs | Analysis |
|---|---|---|---|---|---|---|---|
| 1 | 671 | 2015 | 3617 | MA Starc | Australia | Nzl | 9.0 - 0 - 28 - 6 |
| 2 | 603 | 2015 | 3607 | TG Southee | New Zealand | Eng | 9.0 - 0 - 33 - 7 |
| 3 | 484 | 2015 | 3617 | TA Boult | New Zealand | Aus | 10.0 - 3 - 27 - 5 |
| 4 | 444 | 2015 | 3600 | MR Marsh | Australia | Eng | 9.0 - 0 - 33 - 5 |
| 5 | 429 | 2015 | 3602 | Sohail Khan | Pakistan | Ind | 10.0 - 0 - 55 - 5 |
| 6 | 358 | 2015 | 3616 | Imran Tahir | South Africa | Win | 10.0 - 2 - 45 - 5 |
| 7 | 352 | 2015 | 3620 | Mohammad Irfan | Pakistan | Zim | 10.0 - 2 - 30 - 4 |
| 8 | 320 | 2015 | 3608 | JE Taylor | West Indies | Pak | 7.0 - 1 - 15 - 3 |
| 9 | 319 | 2015 | 3621 | KJ Abbott | South Africa | Ire | 8.0 - 0 - 21 - 4 |
| 10 | 307 | 2015 | 3600 | ST Finn | England | Aus | 10.0 - 0 - 71 - 5 |
Mohammed Irfan's excellent spell which included three top-order wickets got him into the top-ten bowling performances. His spell was worth 352 rating pts. Wahab Riaz could not make the bowling cut since most of his wickets were late order ones. Kyle Abbott's powerful spell of 4 for 21 against Ireland is also in a top-ten position, with 319 rating pts.
| SNo | Rating Pts | Year | ODI# | Player | For | Vs | Runs | Balls | Analysis |
|---|---|---|---|---|---|---|---|---|---|
| 1 | 700 | 2015 | 3612 | CH Gayle | West Indies | Zim | 215 | 147 | 6.0-0-35-2 |
| 2 | 579 | 2015 | 3615 | TM Dilshan | Sri Lanka | Bng | 161* | 146 | 8.0-0-35-2 |
| 3 | 496 | 2015 | 3600 | MR Marsh | Australia | Eng | 23 | 20 | 9.0-0-33-5 |
| 4 | 447 | 2015 | 3620 | Wahab Riaz | Pakistan | Zim | 54* | 46 | 9.4-1-45-4 |
| 5 | 434 | 2015 | 3611 | MM Ali | England | Sco | 128 | 107 | 10.0-0-47-2 |
| 6 | 353 | 2015 | 3608 | AD Russell | West Indies | Pak | 42* | 13 | 8.0-2-33-3 |
| 7 | 317 | 2015 | 3614 | RD Berrington | Scotland | Afg | 25 | 46 | 10.0-0-40-4 |
| 8 | 298 | 2015 | 3606 | SC Williams | Zimbabwe | Uae | 76* | 65 | 8.0-0-43-2 |
| 9 | 297 | 2015 | 3613 | Amjad Javed | U.A.E. | Ire | 42 | 35 | 10.0-0-60-3 |
| 10 | 281 | 2015 | 3599 | CJ Anderson | New Zealand | Slk | 75 | 46 | 3.1-0-18-2 |
However, Wahab Riaz's fifty and four wickets did very well in the all-rounder stakes. This dual performance secured 447 rating pts and was placed fourth, behind the three early leaders, Chris Gayle, Tillakaratne Dilshan and Mitchell Marsh.
| SNo | Rating Pts | Year | ODI# | Team | Own score | Vs | Other score |
|---|---|---|---|---|---|---|---|
| 1 | 721 | 2015 | 3616 | South Africa | 408 for 5 in 50.0 | Win | 151 for 10 in 33.1 |
| 2 | 714 | 2015 | 3607 | New Zealand | 125 for 2 in 12.2 | Eng | 123 for 10 in 33.2 |
| 3 | 691 | 2015 | 3610 | India | 307 for 7 in 50.0 | Saf | 177 for 10 in 40.2 |
| 4 | 678 | 2015 | 3621 | South Africa | 411 for 4 in 50.0 | Ire | 210 for 10 in 45.0 |
| 5 | 665 | 2015 | 3618 | India | 104 for 1 in 18.5 | Uae | 102 for 10 in 31.3 |
| 6 | 665 | 2015 | 3608 | West Indies | 310 for 6 in 50.0 | Pak | 160 for 10 in 39.0 |
| 7 | 645 | 2015 | 3619 | Sri Lanka | 312 for 1 in 47.2 | Eng | 309 for 6 in 50.0 |
| 8 | 640 | 2015 | 3605 | Bangladesh | 267 for 10 in 50.0 | Afg | 162 for 10 in 42.5 |
| 9 | 626 | 2015 | 3611 | England | 303 for 8 in 50.0 | Sco | 184 for 10 in 42.2 |
| 10 | 625 | 2015 | 3615 | Sri Lanka | 332 for 1 in 50.0 | Bng | 240 for 10 in 47.0 |
Sri Lanka's nine-wicket win fetched them 645 rating pts and got them in at the sixth position. The difference between this match and New Zealand's dismantling of England was that Sri Lanka's bowling was rated below par: after all they conceded 309 runs. All departments of New Zealand were treated above par. The comprehensive South African win over Ireland did enough to get into the fourth place with 678 rating pts. However the Irish recovery from 48 for 5 meant that the margin was reduced considerably.
A brief introduction into the methodology of Performance Analysis.
The Batting Performance Ratings analysis takes into account the Runs scored, Balls faced, Next highest score (if this is the highest score), % of Team score, Innings status at entry, Bowling quality, Pitch information, Team strengths, Target score in front, Match location, Result and Match importance. These parameters are given appropriate weights. The calculations are done in such a way that Rating points of 1000 would be allotted to a mind-blowing and match-winning score of 200 in 150 balls in a WC final.
The Bowling Performance Ratings analysis takes into account the Wickets captured, Quality of batsmen dismissed, Scores at which batsmen were dismissed, Bowling accuracy, Batting quality, Pitch information, Team strengths, Target being defended, Match location, Result and Match importance. The calculations are done in such a way that Rating points of 1000 would be allotted to a magnificent and match-winning analysis of 10-2-15-6 in a WC final.
The Player Performance Ratings analysis takes into account the Batting Rating points, Bowling Rating points and the Fielding Rating points, which is a combination of catches and stumpings. There are minimum criteria for batting and bowling stints to ensure that these are genuinely all-round performances.
The Team Performance Ratings analysis takes into account the Result, Margin of win, Resources utilized, Team strengths, Match location and Match importance. The calculations are done in such a way that Rating points of 1000 would be allotted to an overwhelming win by 150 runs or 8 wickets in a WC final.
Anantha Narayanan has written for ESPNcricinfo and CastrolCricket and worked with a number of companies on their cricket performance ratings-related systems