Nine semi-finals, zero wins
New Zealand and South Africa have together played nine World Cup semi-finals and they haven't won a single one - yet
S Rajesh
Mar 22, 2015, 1:14 PM
Martin Guptill is the only New Zealand batsman to score a century in this World Cup, while South Africa have five batsmen who've scored hundreds • Getty Images
6-2 South Africa's head-to-head advantage over New Zealand since the 2011 World Cup, when they lost to them by 49 runs in Mirpur. Since then, New Zealand won a three-match series 2-1 in South Africa in 2013, but South Africa won two series in New Zealand - 3-0 in 2012, and 2-0 in 2014. South Africa have a 9-9 win-loss record against New Zealand in New Zealand, but have won each of their last five ODIs there.
4-2 New Zealand's head-to-head advantage in six World Cup games between the two teams - they've won each of the last three, in Mirpur in 2011, St George's, Granada in 2007, and Johannesburg in 2003. They also played at Eden Park, Auckland, in the 1992 World Cup, a match which New Zealand won by seven wickets.
0 The number of wins for both teams in nine World Cup semi-finals. New Zealand have lost each of the six World Cup semi-finals they have played - in 1975, 1979, 1992, 1999, 2007 and 2011 - while South Africa lost in 1992 and 2007, and tied against Australia in 1999, which led to their elimination as Australia finished higher than them in the Super Six table.
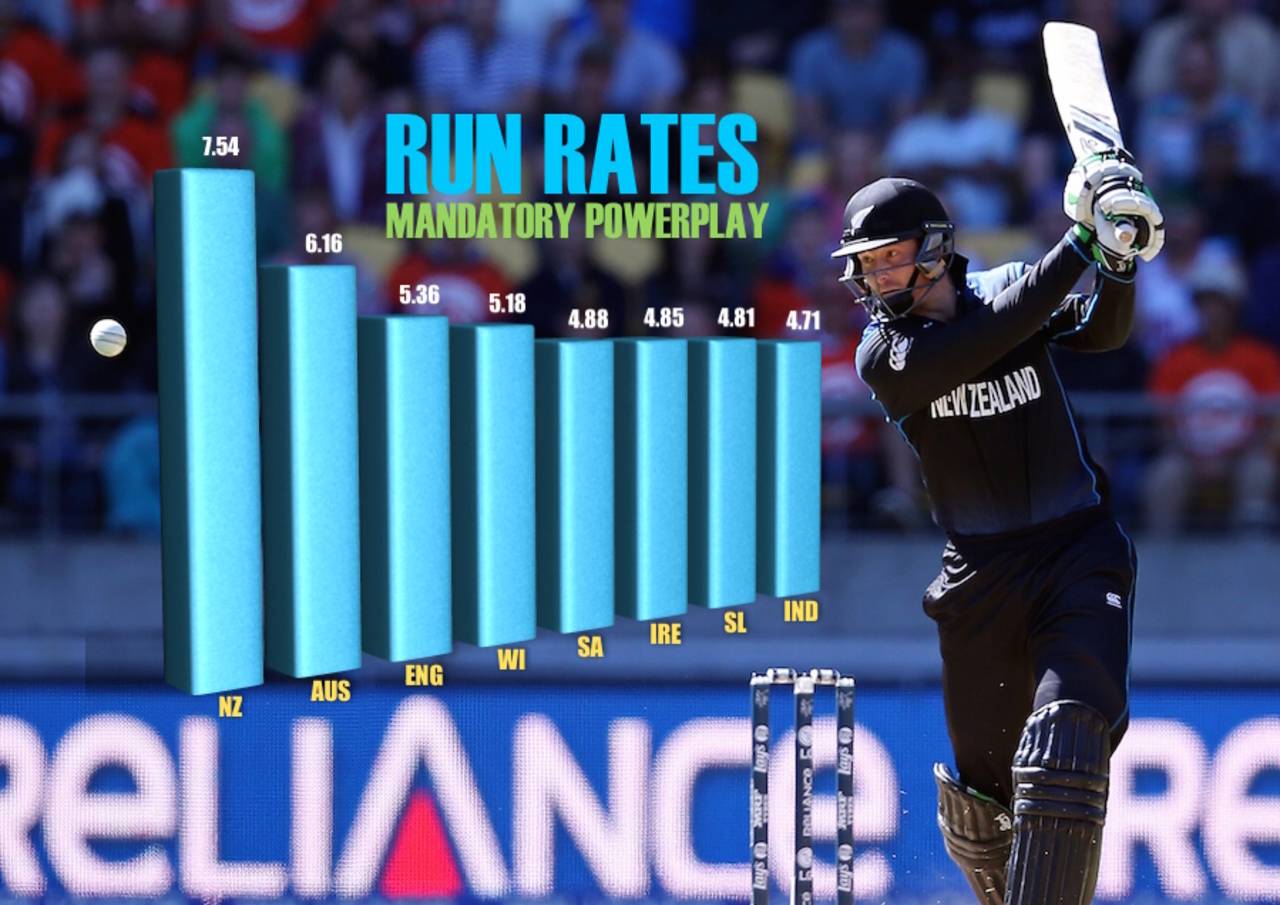
7.54 New Zealand's run rate in the mandatory Powerplay overs, easily the best among all teams in this tournament. Australia are next with a rate of 6.16. South Africa are fifth with a run rate of 4.95.
16 Wickets for New Zealand in the mandatory Powerplays, the joint-highest in the tournament along with West Indies. New Zealand's 16 wickets have cost 20.06 each, while they've conceded 4.58 runs per over in the mandatory Powerplays. South Africa have taken 12 wickets during this period, at an average of 24.83 and an economy rate of 4.25. Trent Boult leads the way with ten wickets during this period - the most by any bowler - while South Africa's best is Kyle Abbott with six. Dale Steyn has only three wickets during the mandatory Powerplays.
11.84 South Africa's run rate in the last 15 overs, the best among all teams during this period; they also average 70.36 in the last 15, which is the highest among all teams. Their run rate in the batting Powerplays is 9.43; the next best is Australia at 7.85. New Zealand have a run rate of 9.95 in the last 15, and 7.05 in the batting Powerplays.
5.78 South Africa's economy rate in the last 15, again the best among all teams. They have taken 26 wickets during this period, second only to India's 27. New Zealand's economy rate of 6.27 during this period is third among all teams in this World Cup.
15 Wickets taken by the leading spinner for each team. Daniel Vettori has averaged 15.73 at an economy rate of 3.81, while Imran Tahir has an average of 18.86 and an economy rate of 4.20.
38 Wickets that New Zealand have taken in the middle overs (between 11th and 35th), easily the highest by any team. India are next with 31, followed by Australia (29) and South Africa (28).
5 Number of batsmen who've scored hundreds for South Africa - AB de Villiers, David Miller, Faf du Plessis, JP Duminy and Hashim Amla. No other team have five different centurions in this World Cup. For New Zealand, Martin Guptill is the only batsman who has scored a hundred.
5-1 The win-loss record for teams batting first in the last seven ODIs in Auckland - one game was tied. All of these were day-night games. In these seven games, the average 50-over score for the team batting first has been 245, with only two scores in excess of 250. In this World Cup, Australia have scored 151 (lost to New Zealand), Pakistan 222 (beat South Africa) and Zimbabwe 287 (lost to India) when batting first here.
62 The combined strike rate for Brendon McCullum and Kane Williamson against Steyn in ODIs. McCullum has scored 39 from 62 balls, and Williamson 27 from 44. However, Steyn hasn't dismissed them often: McCullum has got out once, and Williamson never to Steyn in ODIs. Against Morne Morkel, these two batsmen have collectively scored 93 from 92 balls (strike rate 101) and got out twice.
105 Amla's strike rate against Boult in ODIs - he has scored 41 from 39 balls without being dismissed.
96 The combined strike rate for de Villiers and Amla against Tim Southee. De Villiers has scored 52 off 46 balls (dismissed once), and Amla has 66 from 77 balls (dismissed twice).
S Rajesh is stats editor of ESPNcricinfo. @rajeshstats