Stats give India edge in familiar face-off
India are the only unbeaten team in the tournament, while their recent record against Sri Lanka, and in finals, is also a cause for confidence
S Rajesh
Apr 5, 2014, 6:14 PM
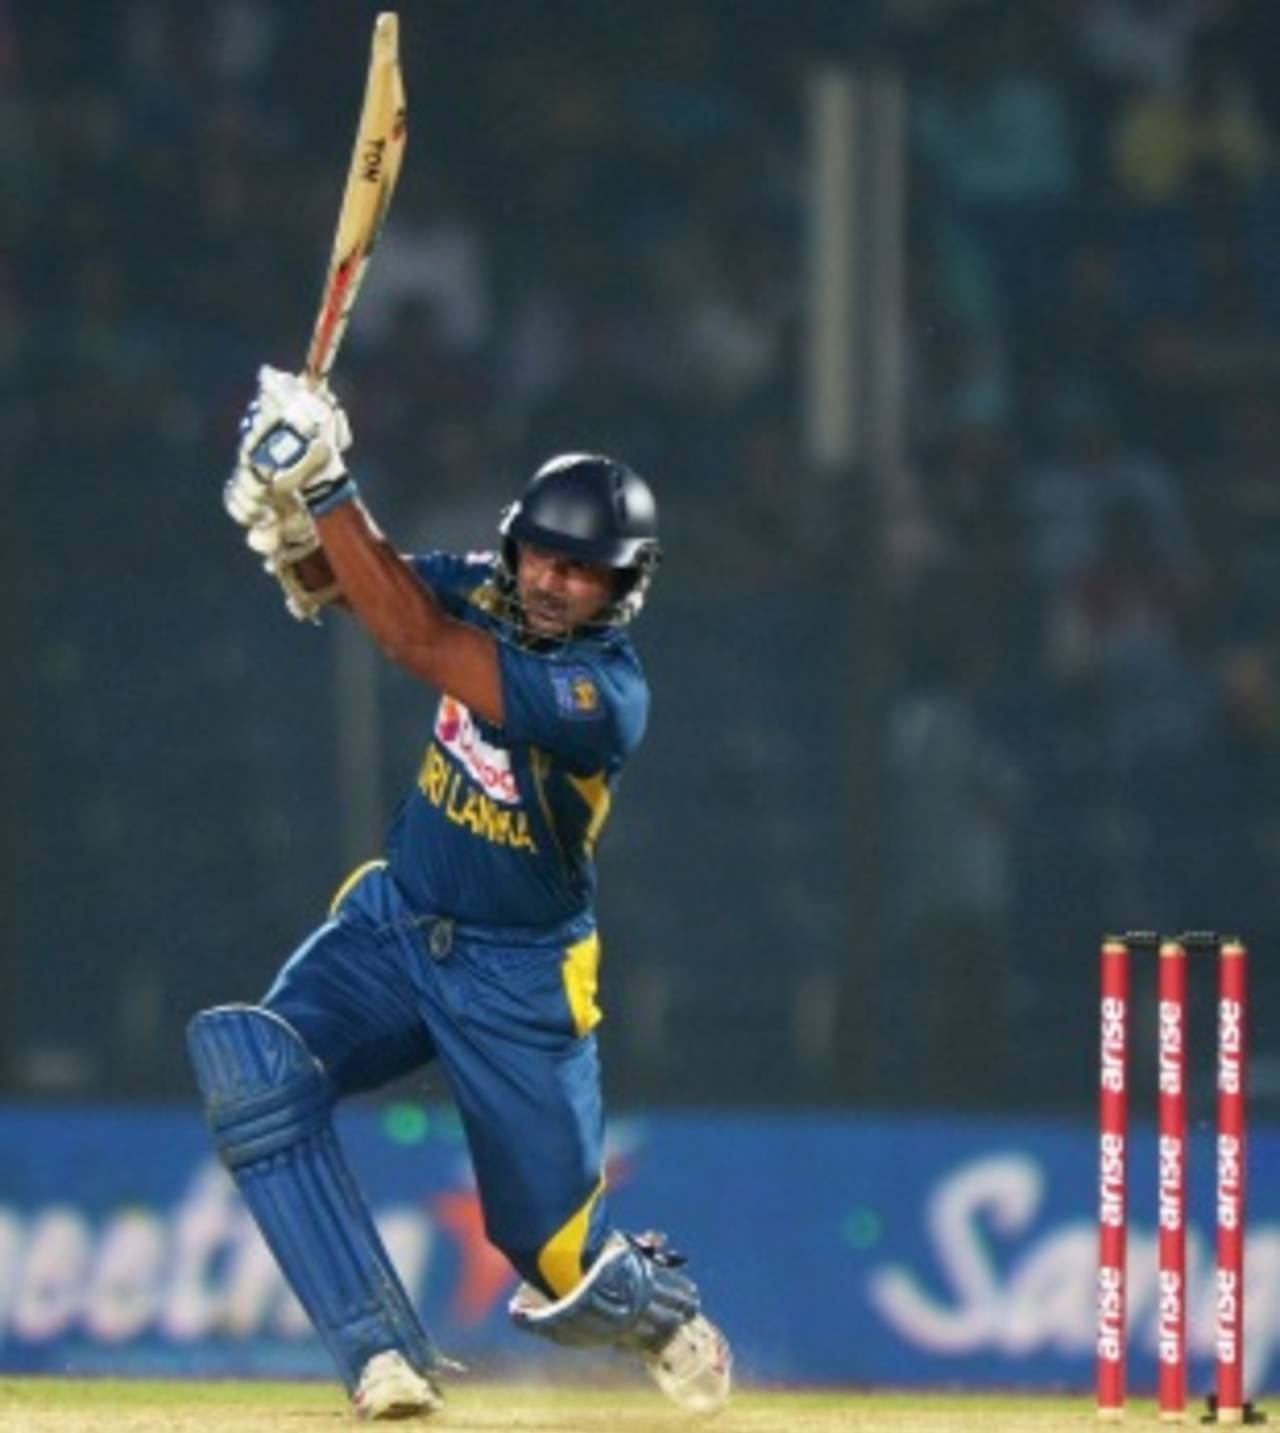
Kumar Sangakkara has scored 183 runs from three innings in T20Is versus India, but in this tournament so far he has only managed 19 in four innings • AFP
The head-to-head in finals
Since the beginning of 2008, India and Sri Lanka have played 63 international matches, which equals the highest by any two teams during this period. Australia and England have played that many times as well, but while 20 of the 63 Australia-England clashes have been in Tests, India and Sri Lanka have met only nine times in the five-day format during this period, and five times in Twenty20s, which means the overwhelming majority of matches have been ODIs (49, easily the most by any two teams).
Since the beginning of 2008, India and Sri Lanka have played 63 international matches, which equals the highest by any two teams during this period. Australia and England have played that many times as well, but while 20 of the 63 Australia-England clashes have been in Tests, India and Sri Lanka have met only nine times in the five-day format during this period, and five times in Twenty20s, which means the overwhelming majority of matches have been ODIs (49, easily the most by any two teams).
Clearly, the two teams are familiar opponents for each other, but what might also worry Sri Lanka is the dominance India have had over them recently. In the 49 ODIs since 2008, India have a 29-17 advantage, and a 3-2 edge in the five Twenty20 internationals. Moreover, India have also shaken off the tag of choking in finals, something that was reinforced by a string of defeats in finals during the Sourav Ganguly era. Under MS Dhoni, they've exuded a confidence that only comes with deep self-belief, and they have the numbers to show they relish a big match: in their last 12 finals since the World Twenty20 in 2007 - all of them under Dhoni's leadership - India have won eight and lost four. That's significantly better than Sri Lanka's 8-9 record in finals during this period.
The familiarity with each other extends to the finals as well: the two teams have played each other seven times in finals, which is four times more than any other pair of teams. India have a 4-3 edge, but that also means three of their four defeats in finals have come against Sri Lanka: in the Asia Cup in 2008, a tri-nation tournament in Bangladesh in 2010, and a triangular in Sri Lanka the same year. Since then, though, India have won three finals in a row: the 2011 World Cup, the 2013 Champions Trophy, and the tri-nation tournament in the West Indies later that year. The first and the last of those wins were against Sri Lanka. In fact, of the last eight finals India have played in limited-overs tournaments, seven have been against Sri Lanka.
Sri Lanka's record in big finals isn't that great in recent times: since 2007, they've lost in the title match of the World Cup and the World Twenty20 twice each. However, they'll have more pleasant recent memories of playing a final in Mirpur: they beat Pakistan by five wickets in the Asia Cup final less than a month ago, at the same venue. That should make them feel good about playing another final there so soon.
| Matches | Won | Lost | Ratio | |
| India - overall (ODIs+T20Is) | 63 | 26 | 32 | 0.81 |
| SL - overall (ODIs+T20Is) | 57 | 29 | 26 | 1.11 |
| India - T20Is | 1 | 1 | 0 | - |
| SL - T20Is | 3 | 1 | 2 | 0.50 |
| India - World Cup+CT+World T20 | 8 | 4 | 2 | 2.00 |
| SL - World Cup+CT+World T20 | 7 | 1 | 4 | 0.25 |
| India - all finals since Jan 2007 | 12 | 8 | 4 | 2.00 |
| SL - all finals since Jan 2007 | 17 | 8 | 9 | 0.88 |
| Matches | Ind won | SL won | NR | |
| Overall | 19 | 9 | 8 | 2 |
| Since Jan 2007 | 7 | 4 | 3 | - |
The tournament stats
In the tournament so far, there has been little to choose between the two teams. India are the only unbeaten side so far, but Sri Lanka have lost only one game, and the conditions in Mirpur should suit them too.
In the tournament so far, there has been little to choose between the two teams. India are the only unbeaten side so far, but Sri Lanka have lost only one game, and the conditions in Mirpur should suit them too.
Sri Lanka have a slightly better run rate, economy rate, and bowling average, while India have a better batting average. Both teams have taken exactly 35 wickets, which shows the effectiveness of their bowling attacks. Sri Lanka have preferred to put the runs on the board - the only time they chased in the tournament was against Netherlands, who were bundled out for 39. India, on the other hand, have preferred to chase, doing so in four out of five matches so far. Given that they've also beaten Sri Lanka twice in recent finals doing so, India might prefer to bat second again if they win the toss in Mirpur.
| W/ L | Bat ave | Run rate | Wkts | Bowl ave | Econ rate | |
| India | 5/ 0 | 38.78 | 7.69 | 35 | 18.71 | 6.79 |
| Sri Lanka | 4/ 1 | 24.03 | 7.98 | 35 | 15.11 | 6.68 |
Both India and Sri Lanka also have similar batting run rates through the first 15 overs of their innings. India have lost fewer wickets - four, to Sri Lanka's nine - which is why their batting average is far better. Two of India's top three have scored more than 170 runs in the tournament, with Virat Kohli's 242 being the highest aggregate of the tournament. Kohli has been dismissed only twice in the tournament, which means he has an average of 121 at a strike rate of 128.04. Rohit Sharma has been impressive as well, with 171 runs at 42.75 and a strike rate of almost 126. (Click here for India's batting and bowling stats.) Suresh Raina has also done well in the limited opportunities he has had, ensuring Shikhar Dhawan's poor form has not affected the team much.
Sri Lanka's highest run-getter has been Mahela Jayawardene with 134 at a strike rate of 131, but they have also been served well by Kusal Perera at the top of the order (120 runs at a strike rate of 158), and Angelo Mathews lower down the order (100 runs at a strike rate of 143). In the last five overs, Mathews has scored 68 from 37 balls - a strike rate of 184. Thanks largely to him, Sri Lanka have scored at ten an over in the last five. (Click here for Sri Lanka's batting and bowling averages.)
| First 6 overs | 6.1 to 15 overs | 15.1 to 20 overs | ||||
| Average | Run rate | Average | Run rate | Average | Run rate | |
| India | 56.25 | 7.50 | 41.00 | 7.28 | 26.28 | 8.83 |
| Sri Lanka | 24.00 | 7.44 | 37.57 | 7.30 | 16.16 | 10.03 |
One of the most impressive aspects of both teams has been their bowling at the start of the innings. Sri Lanka have taken 13 wickets in the first six overs, the highest by any team in the tournament. South Africa's 40 for 1 is the best Powerplay score against them, but the other teams have struggled: England were 37 for 2 after six, West Indies 30 for 2, New Zealand 23 for 4 and Netherlands 15 for 4. South Africa's 44 for 2 is also the best Powerplay score against India; Pakistan were 34 for 1 and West Indies 24 without loss, while Australia and Bangladesh were an identical 27 for 3 after six overs.
Through the middle overs there is little to choose between the two teams, while India have been a little more economical than Sri Lanka in the final five overs.
| First 6 overs | 6.1 to 15 overs | 15.1 to 20 overs | ||||
| Average | Econ rate | Average | Econ rate | Average | Econ rate | |
| India | 17.33 | 5.20 | 22.42 | 6.97 | 15.41 | 8.67 |
| Sri Lanka | 11.15 | 4.83 | 22.30 | 7.37 | 10.44 | 9.55 |
The spin strengths of both teams have also shone through in the tournament. R Ashwin is the fourth-highest wicket-taker in the tournament with 10 at an economy rate of 4.91, while Amit Mishra was outstanding till the semi-final game against South Africa.
Sri Lanka's spin stars have been Rangana Herath - who destroyed New Zealand in the last group match - and Sachitra Senanayake, both of whom have economy rates of less than 4.70. However, Sri Lanka's fast bowlers have been far more incisive than India's, taking 16 wickets in 46.1 overs to India's seven in 31 overs.
| Spin | Pace | |||||||
| Overs | Wkts | Average | Econ rate | Overs | Wkts | Average | Econ rate | |
| India | 65.2 | 24 | 17.58 | 6.45 | 31.0 | 7 | 31.00 | 7.00 |
| Sri Lanka | 33.0 | 14 | 15.28 | 6.48 | 46.1 | 16 | 19.06 | 6.60 |
The final will also be the last Twenty20 international for two Sri Lankan legends, Mahela Jayawardene and Kumar Sangakkara, both of whom have contrasting T20I stats against India: Sangakkara has scored 183 from three innings at a strike rate of 181, while Jayawardene has scored 51 from four innings. Jayawardene has had the better tournament so far - Sangakkara has scored all of 19 runs in four innings. Both will want a farewell as memorable as Sachin Tendulkar's last World Cup game, which, incidentally, was also an India-Sri Lanka final.
S Rajesh is stats editor of ESPNcricinfo. Follow him on Twitter