A spotless Test record
Over a Test career that lasted 18 years, there were hardly any boxes that Jacques Kallis did not tick
S Rajesh
31-Dec-2013
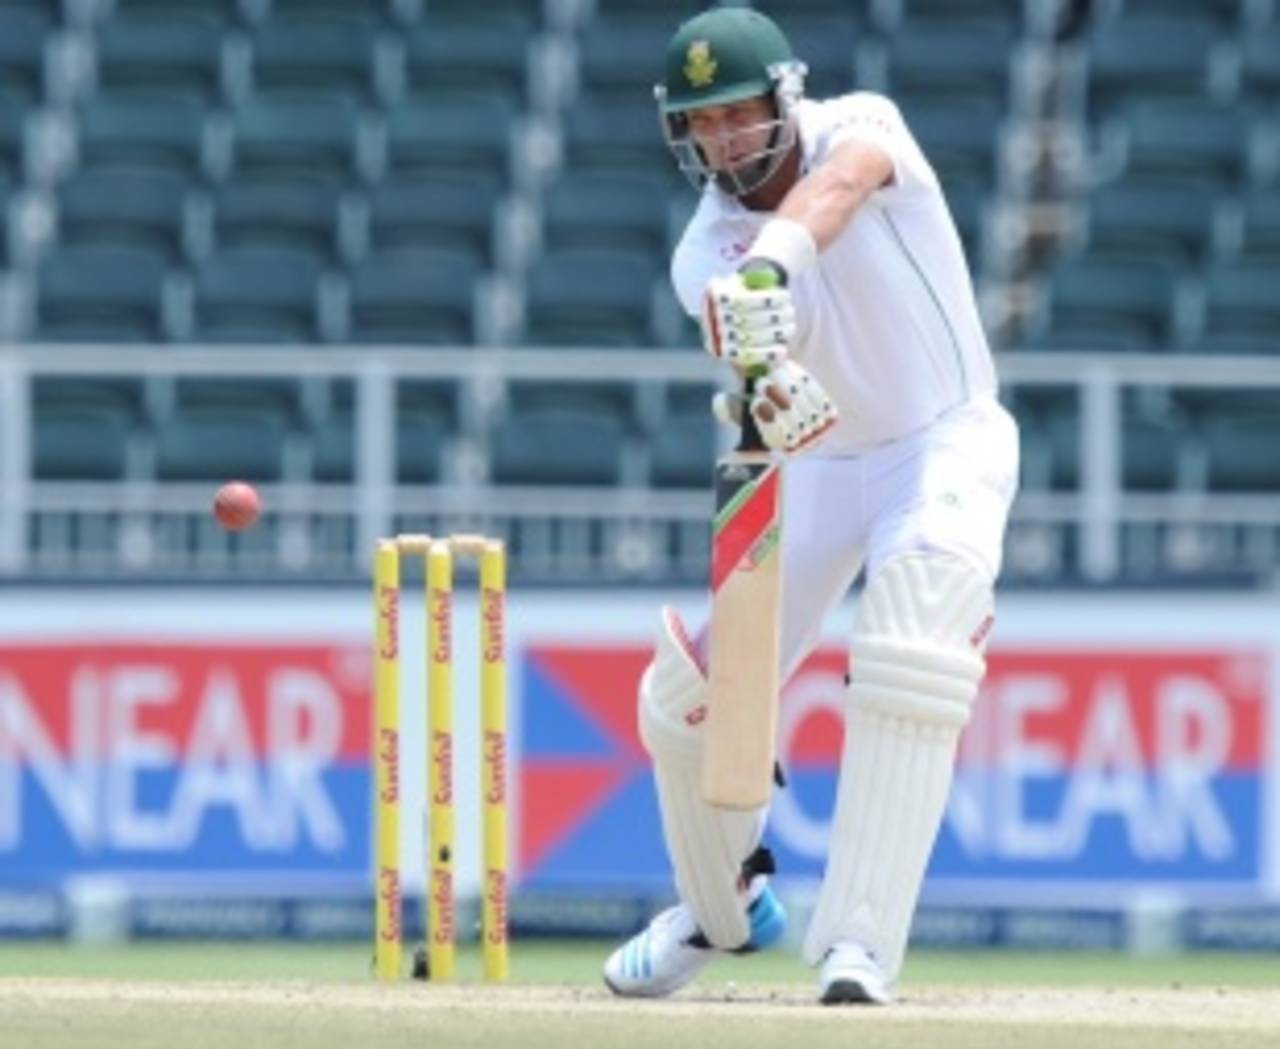
Between 1999 and 2012, Jacques Kallis averaged 61.33 in Tests, easily the best among all batsmen • AFP
Only Sachin Tendulkar and Ricky Ponting scored more Test runs than him. However, with Jacques Kallis the runs he scored only tells part of the story, because he also sent down 3372 overs in Tests (Tendulkar and Ponting together bowled 804.3) and took 292 wickets - 29th in the list of all-time leading wicket-takers in Tests, and fifth-best among South Africans. Add the two and you get an idea of just how staggering Kallis's achievements were in Test cricket.
For close to two decades, Kallis handled the burden of contributing significantly with both bat and ball, which allowed South Africa the luxury of playing six specialist batsmen, plus a wicketkeeper and five bowlers. The bowling eventually took a back seat, but throughout the 2000s there was no batsman as prolific as Kallis.
For a batsman who became so consistent, the start to his career was surprisingly slow. In his first seven innings he reached double digits just once: his scores read 1, 7, 6, 39, 0, 2, 2 - he started off as a 20-year-old against England and Australia, and the baptism was clearly a tough one. After 22 Tests he averaged less than 31. Even in those early days, though, there were unmistakable signs of class: in Melbourne in 1997, he scored 101 in the fourth innings - his first Test century - to help South Africa bat 122 overs and save the Test. Next year in England he made another century, and when West Indies toured in 1998-99, Kallis scored a mountain of runs - 485 in five Tests - that kickstarted his international career.
Over the next nine years Kallis averaged more than 65, with 27 centuries. Though there was a brief slump in 2008, he was again back at his best between 2009 and 2012. The century in his last Test innings - the fourth South African batsman to achieve this - ensured he scored at least one century in a calendar year for 17 successive years, from 1997 to 2013. (Click here for Kallis' batting career summary.)
As a bowler, Kallis' effectiveness waned as he went along. In his first 65 Tests he averaged more than two wickets per Test but after 2008 he barely managed one per match, while the number of overs he bowled per Test dropped as well.
| Period | Tests | Runs | Average | Strike rate | 100s/ 50s |
| Till Dec 1998 | 22 | 1019 | 30.87 | 36.62 | 2/ 5 |
| Jan 1999 to Dec 2007 | 90 | 8263 | 65.06 | 44.96 | 27/ 41 |
| Jan 2008 to Feb 2009 | 17 | 778 | 31.12 | 45.76 | 1/ 4 |
| Mar 2009 to Dec 2012 | 29 | 2920 | 67.90 | 54.21 | 14/ 6 |
| 2013 | 8 | 309 | 25.75 | 47.03 | 1/ 2 |
| Career | 166 | 13289 | 55.37 | 45.97 | 45/ 58 |
| Period | Tests | Wickets | Average | Strike rate | 5WI | Overs/Test |
| Till 2002 | 65 | 136 | 28.30 | 63.80 | 3 | 22.4 |
| 2003 to 2008 | 62 | 115 | 34.14 | 68.1 | 2 | 21.0 |
| 2009 onwards | 39 | 41 | 42.87 | 90.4 | 0 | 15.5 |
| Career | 166 | 292 | 32.65 | 69.2 | 5 | 20.2 |
Battle of the allrounders
What set Kallis apart among modern-day allrounders was the fact that he averaged more than 50 with the bat - and was clearly among the best batsmen of his era - and yet took enough wickets to qualify as a genuine allrounder: no other player has achieved the double of 6000 runs and 250 wickets in Tests. Most of the other top allrounders batted at No. 6 or 7 and averaged in the mid-30s with the bat, but Kallis's batting skills were clearly superior.
What set Kallis apart among modern-day allrounders was the fact that he averaged more than 50 with the bat - and was clearly among the best batsmen of his era - and yet took enough wickets to qualify as a genuine allrounder: no other player has achieved the double of 6000 runs and 250 wickets in Tests. Most of the other top allrounders batted at No. 6 or 7 and averaged in the mid-30s with the bat, but Kallis's batting skills were clearly superior.
The table below lists the top allrounders by the difference between their batting and bowling averages, and the only player with similar stats as Kallis is Garry Sobers - he averaged 57.78 with the bat and 34.03 with the ball, and the difference of 23.74 is marginally higher than Kallis' 22.72.
The other allrounders all have a difference of less than 15 between their batting and bowling averages, which is where Kallis's numbers stand out. However, Kallis averaged only 1.76 wickets per Test, while the others in the list below (apart from Sobers) took at least three per match.
| Player | Tests | Runs | Bat ave | Wickets | Bowl ave | Difference* |
| Garry Sobers | 93 | 8032 | 57.78 | 235 | 34.03 | 23.74 |
| Jacques Kallis | 166 | 13,289 | 55.37 | 292 | 32.65 | 22.72 |
| Imran Khan | 88 | 3807 | 37.69 | 362 | 22.81 | 14.88 |
| Keith Miller | 55 | 2958 | 36.97 | 170 | 22.97 | 13.99 |
| Shaun Pollock | 108 | 3781 | 32.31 | 421 | 23.11 | 9.19 |
| Ian Botham | 102 | 5200 | 33.54 | 383 | 28.40 | 5.14 |
| Richard Hadlee | 86 | 3124 | 27.16 | 431 | 22.29 | 4.86 |
| Chris Cairns | 62 | 3320 | 33.53 | 218 | 29.40 | 4.13 |
| Kapil Dev | 131 | 5248 | 31.05 | 434 | 29.64 | 1.40 |
Given the similarity in their numbers, it's clear that Sobers is the one player whose career numbers in both batting and bowling can be compared with Kallis. There's little to choose between their batting averages, but what stands out among the bowling numbers is the amount of overs Sobers bowled per Test - 39, compared with 20 for Kallis.
Sobers' career stretched over 20 years as well but because of the lesser frequency of matches, he only played 93 Tests, to Kallis's 166. Extrapolating Sobers's numbers after 93 matches and stretching it over 166 Tests, Sobers's career stats go up to 14,337 with 46 hundreds (to Kallis's 13,289 with 45), 195 catches (to Kallis's 200), and 419 wickets (to Kallis's 292). Clearly, the fact that Sobers bowled nearly twice as many overs per match as Kallis contributes to the huge difference in wickets.
| Tests | Runs | Average | 100s/ 50s | |
| Garry Sobers | 93 | 8032 | 57.78 | 26/ 30 |
| Jacques Kallis | 166 | 13,289 | 55.37 | 45/ 58 |
| Wickets | Average | Strike rate | 5WI | Overs/Test | |
| Garry Sobers | 235 | 34.03 | 91.9 | 6 | 39 |
| Jacques Kallis | 292 | 32.65 | 69.2 | 5 | 20 |
Best between 1999 and 2012
Kallis's first 22 Tests brought him an average of only 30.87, while his last eight - all of them in 2013 - were similarly disappointing. But in between, in 136 Tests he averaged a staggering 61.33, easily the best among batsmen who scored at least 5000 runs during this period; in fact, even after reducing the qualification mark to 300 runs, no batsman has a higher average.
Kallis's first 22 Tests brought him an average of only 30.87, while his last eight - all of them in 2013 - were similarly disappointing. But in between, in 136 Tests he averaged a staggering 61.33, easily the best among batsmen who scored at least 5000 runs during this period; in fact, even after reducing the qualification mark to 300 runs, no batsman has a higher average.
With a 5000-run cut-off, Kumar Sangakkara has the next-best average during this period, more than five runs below Kallis's mark. Ten batsmen had averages between 52.50 and 55.80, but Kallis stood alone on top, well clear of the others.
| Batsman | Tests | Runs | Average | Strike rate | 100s/ 50s |
| Jacques Kallis | 136 | 11,961 | 61.33 | 46.97 | 42/ 51 |
| Kumar Sangakkara | 115 | 10,045 | 55.80 | 53.84 | 30/ 41 |
| Brian Lara | 74 | 7212 | 54.63 | 59.19 | 24/ 23 |
| Inzamam-ul-Haq | 69 | 5670 | 54.51 | 55.49 | 19/ 25 |
| Sachin Tendulkar | 131 | 10,892 | 54.18 | 54.33 | 34/ 47 |
| Ricky Ponting | 146 | 12,169 | 54.08 | 60.10 | 39/ 55 |
| Shivnarine Chanderpaul | 113 | 8643 | 54.01 | 43.45 | 25/ 44 |
| Mohammad Yousuf | 83 | 7082 | 53.24 | 53.10 | 23/ 29 |
| Matthew Hayden | 96 | 8364 | 52.93 | 60.85 | 29/ 29 |
| Michael Clarke | 88 | 6910 | 52.74 | 55.98 | 22/ 24 |
| Rahul Dravid | 140 | 11,455 | 52.54 | 43.49 | 34/ 48 |
Tough to dislodge
Over his career entire career, Kallis faced 28,903 balls, next only to Rahul Dravid and Sachin Tendulkar. He was dismissed 240 times, which means he faced 120 deliveries, on average, per dismissal. Among batsmen who faced at least 7000 balls in Tests since the beginning of 1995, only Dravid averaged more balls per dismissal, which indicates just how difficult it was to get Kallis out.
Over his career entire career, Kallis faced 28,903 balls, next only to Rahul Dravid and Sachin Tendulkar. He was dismissed 240 times, which means he faced 120 deliveries, on average, per dismissal. Among batsmen who faced at least 7000 balls in Tests since the beginning of 1995, only Dravid averaged more balls per dismissal, which indicates just how difficult it was to get Kallis out.
Shivnarine Chanderpaul is next in with an average of 119.55 balls, but the batsman in fourth place is a bit of a surprise: New Zealand's Mark Richardson averaged fewer than 45 runs per dismissal, but he scored his runs at a rate of 38 per 100 balls, significantly slower than the likes of Kallis and even Dravid. That meant he faced almost 119 balls per dismissal, less than two balls fewer than Kallis.
| Batsman | Tests | Runs | Average | Strike rate | Balls | Balls per dis |
| Rahul Dravid | 164 | 13,288 | 52.31 | 42.51 | 31,258 | 123.06 |
| Jacques Kallis | 166 | 13,289 | 55.37 | 45.97 | 28,903 | 120.43 |
| Shivnarine Chanderpaul | 148 | 10,916 | 51.98 | 43.47 | 25,106 | 119.55 |
| Mark Richardson | 38 | 2776 | 44.77 | 37.66 | 7370 | 118.87 |
| Hashan Tillakaratne | 55 | 3132 | 46.05 | 40.35 | 7762 | 114.15 |
| Steve Waugh | 99 | 7115 | 55.15 | 48.50 | 14,669 | 113.71 |
| Andy Flower | 53 | 4209 | 51.96 | 45.75 | 9199 | 113.57 |
| Gary Kirsten | 90 | 6626 | 46.66 | 43.89 | 15,096 | 106.31 |
Colossal at No. 4
Of the 280 times Kallis batted in Tests, 170 were at the No. 4 position, a slot where he scored more than 9000 runs at an average of nearly 62. It was clearly his favourite batting position, and it was a slot where he excelled.
Of the 280 times Kallis batted in Tests, 170 were at the No. 4 position, a slot where he scored more than 9000 runs at an average of nearly 62. It was clearly his favourite batting position, and it was a slot where he excelled.
Among batsmen who scored at least 4000 runs at this position, Greg Chappell came closest to Kallis's average, while Tendulkar and Javed Miandad both averaged slightly more than 54. But Kallis remains the only one with a 60-plus average.
| Batsman | Innings | Runs | Average | 100s/ 50s |
| Jacques Kallis | 170 | 9033 | 61.86 | 35/ 36 |
| Greg Chappell | 86 | 4316 | 59.12 | 15/ 19 |
| Sachin Tendulkar | 275 | 13,492 | 54.40 | 44/ 58 |
| Javed Miandad | 140 | 6925 | 54.10 | 19/ 31 |
| Denis Compton | 86 | 4234 | 53.39 | 13/ 20 |
| Inzamam-ul-Haq | 98 | 4867 | 52.90 | 15/ 21 |
| Mahela Jayawardene | 177 | 8656 | 52.46 | 28/ 30 |
| Brian Lara | 148 | 7535 | 51.25 | 24/ 31 |
Apart from the sheer number of runs he scored at No. 4, Kallis also distinguished himself by scoring heavily no matter when he came in to bat. Regardless of whether he came in after two wickets had fallen early, or if the top three had scored plenty of runs, Kallis came in and did his job. On the 26 occasions when he came in with South Africa two down for 20 or fewer, Kallis averaged 56.83. In corresponding innings, Tendulkar's No. 4 average read 40.52.
One of the best examples of Kallis working a difficult situation to his advantage came in Nagpur in 2010, when South Africa batted first and were reduced to 6 for 2, before Kallis and Hashim Amla added 340 for the third wicket. South Africa scored 558, and won by an innings. Against Australia in Durban in 2006, Kallis came in at 10 for 2 and scored 114 out of a team total of 267.
Tendulkar had some memorable knocks too when he came in early - his 116 in the Boxing Day Test at the MCG came from a score of 11 for 2, while India were 6 for 2 in the fourth innings when he scored that memorable 136 against Pakistan in Chennai in 1999. But the difference between the two batsmen was the failure rate when they came in early: Tendulkar fell for single-digit scores 15 times in 37 innings when he came in with the score reading 20 or fewer; Kallis failed similarly only six times in 26 innings.
| Score | Innings | Runs | Average | 100s/ 50s |
| Less than, equal to 20 | 26 | 1307 | 56.83 | 5/ 5 |
| 21 to 49 | 36 | 1813 | 54.94 | 9/ 5 |
| 50 to 99 | 49 | 2422 | 56.33 | 9/ 9 |
| 100 to 149 | 26 | 1254 | 57.00 | 4/ 6 |
| 150 and above | 33 | 2237 | 89.48 | 8/ 11 |
| Score | Innings | Runs | Average | 100s/ 50s |
| Less than 20 | 37 | 1459 | 40.53 | 5/ 5 |
| 21 to 49 | 68 | 3364 | 50.97 | 9/ 15 |
| 50-99 | 73 | 2818 | 44.73 | 9/ 16 |
| 100-149 | 50 | 2640 | 61.39 | 9/ 9 |
| 150 and above | 47 | 3211 | 80.28 | 12/ 13 |
Conquering difficult home conditions
Home conditions are usually something that batsmen look forward to, but that isn't usually the case for South African batsmen because South Africa has been the toughest place for batting in the last couple of decades. Since 1996, the batting average in South Africa is 29.22, the lowest among all countries. Kallis - and other South African batsmen - thus had the handicap of having to negotiate difficult batting conditions every season, as compared to once every few years for overseas batsmen. (Amla, AB de Villiers and Graeme Smith all have significantly better averages overseas than at home.)
Home conditions are usually something that batsmen look forward to, but that isn't usually the case for South African batsmen because South Africa has been the toughest place for batting in the last couple of decades. Since 1996, the batting average in South Africa is 29.22, the lowest among all countries. Kallis - and other South African batsmen - thus had the handicap of having to negotiate difficult batting conditions every season, as compared to once every few years for overseas batsmen. (Amla, AB de Villiers and Graeme Smith all have significantly better averages overseas than at home.)
But Kallis was the one batsman who overcame that handicap, averaging 56.73 at home, and scoring more than 7000 runs there. No other batsman has touched 4000 runs, or scored more than ten hundreds, while the averages for everyone else in the list below are in the mid-40s, which indicates just how good Kallis's technique was in difficult conditions.
Most of the top overseas batsmen haven't averaged 50-plus in South Africa either (which is also because of South Africa's top-class bowling attack). Tendulkar, Ponting and Lara all averaged around 46, while Dravid's average fell to 29.71.
Even for Kallis, the combination of home conditions and the Australian attack proved tough: he averaged only 33.62 in 14 Tests against them at home; in Australia, he averaged 48.23.
| Batsman | Tests | Runs | Average | 100s/ 50s |
| Jacques Kallis | 88 | 7035 | 56.73 | 23/ 34 |
| Graeme Smith | 58 | 3914 | 43.48 | 10/ 19 |
| Gary Kirsten | 52 | 3384 | 42.30 | 8/ 16 |
| AB de Villiers | 48 | 3236 | 44.94 | 9/ 19 |
| Herschelle Gibbs | 47 | 3055 | 41.28 | 9/ 10 |
| Mark Boucher | 75 | 3001 | 33.71 | 4/ 20 |
| Hashim Amla | 39 | 2761 | 45.26 | 9/ 16 |
| Daryll Cullinan | 36 | 2363 | 44.58 | 7/ 11 |
At home in Asia
Meanwhile, Kallis is also the only non-Asian batsman to score more than 2000 runs in Asia - he scored 2058 runs at 55.62, showing his technique was equally adept for making runs in spin-friendly conditions as it was to handle pace and seam and swing.
Meanwhile, Kallis is also the only non-Asian batsman to score more than 2000 runs in Asia - he scored 2058 runs at 55.62, showing his technique was equally adept for making runs in spin-friendly conditions as it was to handle pace and seam and swing.
| Batsman | Tests | Runs | Average | 100s/ 50s |
| Jacques Kallis | 25 | 2058 | 55.62 | 8/ 8 |
| Ricky Ponting | 28 | 1889 | 41.97 | 5/ 10 |
| Shivnarine Chanderpaul | 27 | 1850 | 48.68 | 4/ 8 |
| Alastair Cook | 18 | 1802 | 56.31 | 7/ 7 |
| Allan Border | 22 | 1799 | 54.51 | 6/ 8 |
| Graeme Smith | 21 | 1728 | 49.37 | 4/ 7 |
| Matthew Hayden | 19 | 1663 | 50.39 | 4/ 8 |
| Clive Lloyd | 20 | 1629 | 62.65 | 4/ 7 |
Kallis the matchwinner
And finally, Kallis also won more Man-of-the-Match awards than any other player. He won 23 of them, though one was slightly dubious, when, against West Indies in Centurion in 1999, the entire team was given the award by Dennis Lindsay, the adjudicator.
And finally, Kallis also won more Man-of-the-Match awards than any other player. He won 23 of them, though one was slightly dubious, when, against West Indies in Centurion in 1999, the entire team was given the award by Dennis Lindsay, the adjudicator.
In terms of the rate of winning these awards too, Kallis is among the best - only Wasim Akram, Mitchell Johnson, Muttiah Muralitharan and Curtly Ambrose have a higher rate.
| Player | Tests | MoM awards | Rate |
| Wasim Akram | 104 | 17 | 6.12 |
| Mitchell Johnson | 55 | 8 | 6.88 |
| Muttiah Muralitharan | 133 | 19 | 7.00 |
| Curtly Ambrose | 98 | 14 | 7.00 |
| Jacques Kallis | 166 | 23 | 7.22 |
| Kumar Sangakkara | 117 | 15 | 7.80 |
| Imran Khan | 88 | 11 | 8.00 |
| Malcolm Marshall | 81 | 10 | 8.10 |
| Aravinda de Silva | 93 | 11 | 8.45 |
| Ian Botham | 102 | 12 | 8.50 |
| Shane Warne | 145 | 17 | 8.53 |
More stand-out Kallis stats
- Kallis is one of four allrounders to score a century and take a five-for in a Test more than once. He has done it twice. Ian Botham (five times), Garry Sobers and Mushtaq Mohammad (twice each) are the others in this club.
S Rajesh is stats editor of ESPNcricinfo. Follow him on Twitter