Bowlers suffer in unusually high-scoring series
The series average of 41.18 is the highest among the 25 series that these two teams have played in. A review of the statistical highs and lows in the series
S Rajesh
Dec 4, 2012, 12:18 PM
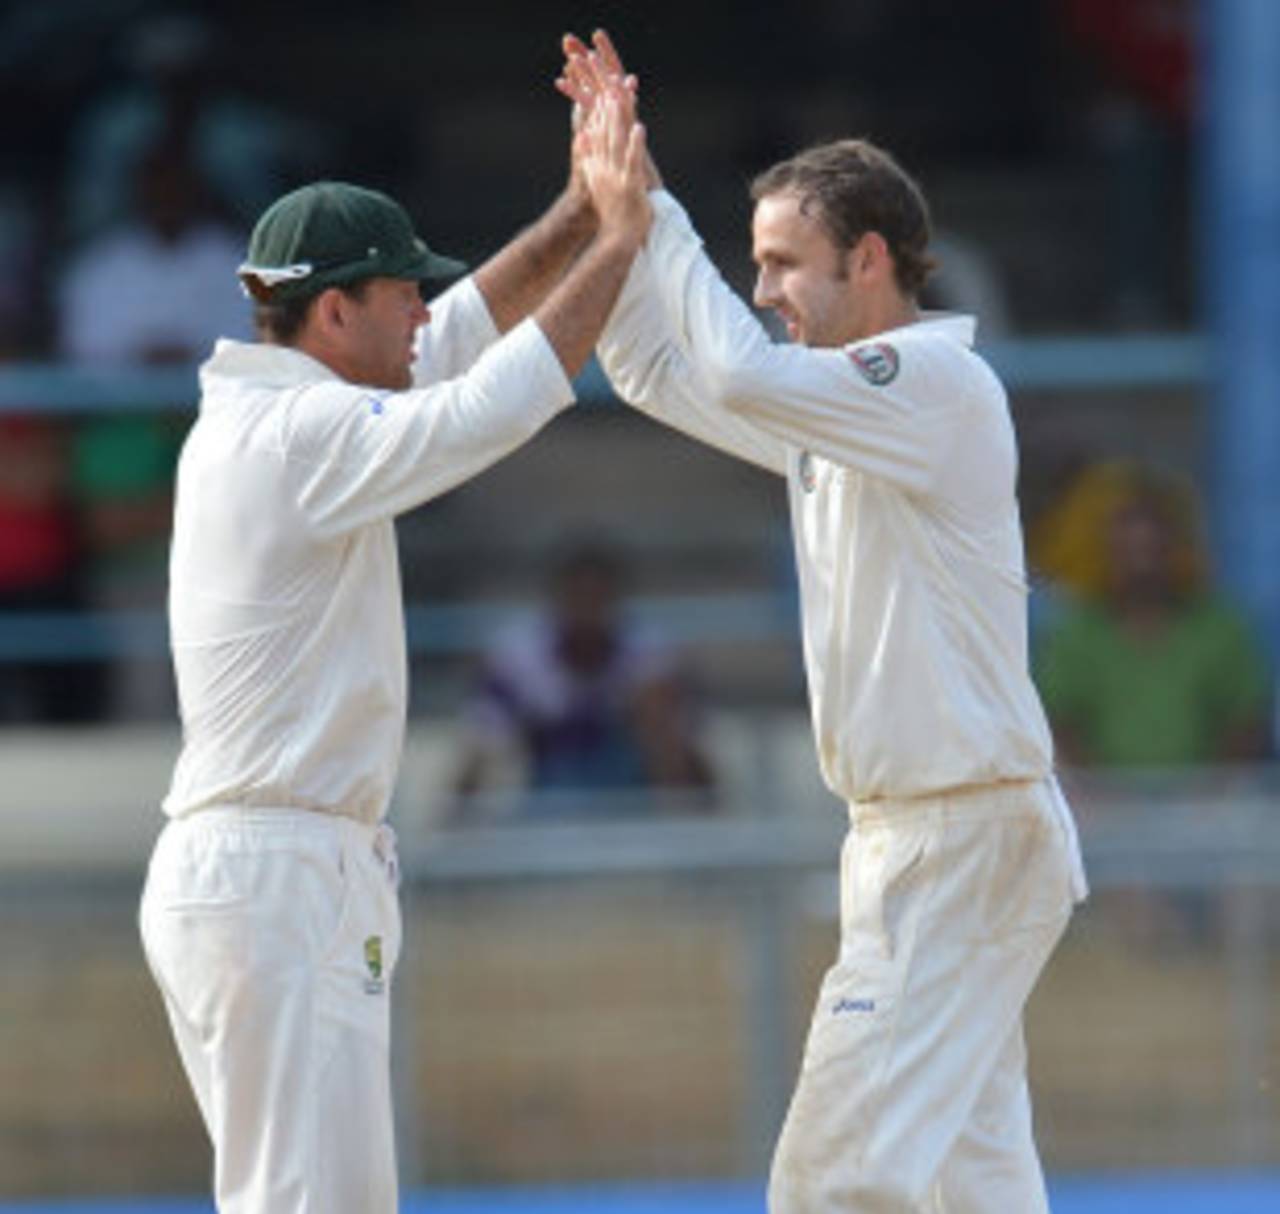
Nathan Lyon dismissed Jacques Rudolph four times conceding only 28 runs, which was the only instance of a bowler getting a batsman out more than thrice in the series • AFP
In two of the three Tests of this series, Australia had the upper hand: they had the better of the drawn game at the Gabba, and then were only denied by some stubborn second-innings batting by South Africa in Adelaide. The crucial difference in the series, though, was how the two teams reacted when things were going for them, and when they weren't. South Africa battled relentlessly when they were down, and rammed home the advantage when they were leading. Australia couldn't do either. The series result was a reflection of that: South Africa 1, Australia 0. That series result also means South Africa have further strengthened their grip on the top spot - there's now six points between them and the second-ranked England. Even if England win the remaining two Tests in India, that difference will only narrow down to four.
The overall stats for the series reflects the way it went for both teams. Australia had a higher batting average, a better scoring rate, and took more wickets than South Africa. They may feel that a 1-1 scoreline would have been a truer indicator of the relative strengths of the two teams, but when Faf du Plessis showed remarkable resilience on debut and was supported by almost every South African batsman, Australia's bowlers couldn't find a way. And when Australia needed to show similar resistance in the second innings in Perth, they collapsed in less than 85 overs.
Overall, this series wasn't a typical one that these two teams usually play. The overall average for the series was 41.18 runs per wicket, which is the highest in the 25 series that these two teams have played. The last time they played, in 2011-12 in South Africa, the average was 26.77, which is the second-lowest. The 12 hundreds scored in the series is also a record for these two teams in a three-Test series.
| Team | W/L/D | Runs scored | Bat ave/RR | 100s/ 50s | Wkts taken | Strike rate |
| South Africa | 1/0/2 | 2046 | 39.34/ 3.01 | 6/ 6 | 43 | 62.98 |
| Australia | 0/1/2 | 1867 | 43.41/ 4.13 | 6/ 4 | 52 | 78.23 |
Though Australia had a higher overall batting average than South Africa, the visitors' top order did better than the home team's. Australia's top-order numbers were pulled down by the poor series that Ricky Ponting had: he scored 32 runs in five innings, his second-worst series average, next only to his average of 3.40 in India in 2001.
On the other hand, Michael Clarke was outstanding, scoring 576 runs in five innings. It's the highest by a batsman in a three-Test series between these two teams. Ironically, the second-highest is 515 in the 2005-06 series in Australia. The other Australian batsman who stood out for his consistency in the series was Michael Hussey: in five innings, he topped 50 three times, and averaged 59.(Click here for Australia's batting and bowling averages in the series.)
Most of the South African top-order batsmen contributed usefully in at least one innings of the series, with six of them aggregating 200 or more runs. Hashim Amla and Jacques Kallis both scored more than 300, while du Plessis fell only seven short despite playing only two Tests. While no batsman touched the heights of Clarke, there were no Ponting-like failures either, though Jacques Rudolph's 74 runs in four innings was disappointing. (Click here for South Africa's batting and bowling averages in the series.)
| Runs | Average | Strike rate | 100s/ 50s | |
| SA top order | 1769 | 46.55 | 48.04 | 6/ 5 |
| Aus top order | 1424 | 43.15 | 63.42 | 6/ 2 |
| SA lower order | 219 | 15.64 | 54.07 | 0/ 1 |
| Aus lower order | 349 | 34.90 | 68.97 | 0/ 2 |
In terms of partnerships, the biggest difference in the numbers for the two teams was the average stands for the second and third wickets: they were the backbone for South Africa, and a liability for Australia. Amla's outstanding form, coupled with useful contributions from Smith, Kallis, Peterson and AB de Villiers, meant South Africa's top three wickets always contributed significant runs; Australia, on the other hand, mostly relied on the middle order bailing them out after the first three wickets had fallen cheaply. Adding up the average partnerships of the top three wickets, South Africa's score at the fall of the third wicket was 169; Australia's was 64.
Australia's strength, though, was their fourth and fifth-wicket partnerships. They added huge runs and put their innings back on track after early setbacks. The lower orders for both teams made vital contributions as well, though in South Africa's case the value was more in terms of time spent at the crease than runs scored.
| Wicket | SA ave | Run rate | 100/ 50 stands | Aus ave | Run rate | 100/ 50 stands |
| 1st | 40.33 | 3.33 | 1/ 0 | 35.20 | 3.89 | 0/ 1 |
| 2nd | 67.33 | 3.86 | 1/ 1 | 14.80 | 2.94 | 0/ 0 |
| 3rd | 61.33 | 3.10 | 1/ 2 | 14.40 | 3.13 | 0/ 0 |
| 4th | 45.00 | 3.08 | 1/ 1 | 90.00 | 4.07 | 2/ 0 |
| 5th | 22.50 | 1.53 | 0/ 1 | 114.20 | 4.90 | 2/ 1 |
| 6th | 48.40 | 3.05 | 1/ 1 | 33.00 | 3.94 | 0/ 1 |
| 7th | 17.20 | 2.42 | 0/ 1 | 23.75 | 3.16 | 0/ 1 |
| 8th to 10th | 24.91 | 3.25 | 0/ 2 | 29.70 | 4.38 | 0/ 1 |
This series was also billed as the battle between the pace attacks of the two teams, but neither returned with outstanding figures. Australia used as many as six specialist fast bowlers in three Tests, but those who played more than a Test all averaged more than 35. For South Africa, Morne Morkel and Dale Steyn were the stars, with Steyn redeeming himself in Perth after two ordinary performances.
Australia's top wicket-taker in the series was Nathan Nyon with 12. Though his average was a relatively high 40.50, he gave the captain plenty of control in the field, going at only 2.73 runs per over. South Africa's spinners, on the other hand, went at more than a run a ball over the entire series. Robin Peterson's impressive six-wicket haul in Perth - only the ninth haul of six or more by a spinner in a Perth Test - was spoiled somewhat by Mitchell Starc's late assault, but Imran Tahir had a terrible game in Adelaide, conceding 260 in 37 wicketless overs, the most runs ever conceded by a bowler in a wicketless Test performance.
| Wickets | Average | Strike rate | Economy rate | 5WI/ 10WM | |
| South Africa - pace | 36 | 35.00 | 60.1 | 3.48 | 1/ 0 |
| Australia - pace | 36 | 39.02 | 76.6 | 3.05 | 1/ 0 |
| South Africa - spin | 6 | 93.33 | 90.17 | 6.21 | 0/ 0 |
| Australia - spin | 14 | 44.00 | 93.4 | 2.82 | 0/ 0 |
Batsman v bowler analysis
In this three-Test series, there were two batsmen who scored more than 100 runs against a bowler: Clarke dominated Morkel, scoring 154 off 164 balls, and getting dismissed only once, while de Villiers scored 101 off Lyon. Clarke also scored 91 off 125 for two dismissals against Steyn, which means his average against South Africa's two best bowlers of the series was 81.67.
On the other hand, though Hussey had a superb series overall, he struggled against these two bowlers, scoring 111 and getting dismissed five times - an average of 22.20.
The only bowler to dismiss a batsman more than three times in the series was Lyon: he nailed Rudolph four times in 100 balls, conceding only 28 runs. Lyon was thus singlehandedly responsible for ruining Rudolph's series: against all other bowlers, Rudolph scored 46 runs off 103 balls, without being dismissed once.
| Batsman | Bowler | Runs | Balls | Dismissals | Average | Run rate |
| Michael Clarke | Morne Morkel | 154 | 164 | 1 | 154.00 | 5.63 |
| AB de Villiers | Nathan Lyon | 101 | 170 | 0 | - | 3.56 |
| Michael Clarke | Dale Steyn | 91 | 125 | 2 | 45.50 | 4.36 |
| Michael Hussey | Morne Morkel | 81 | 146 | 3 | 27.00 | 3.32 |
| Michael Hussey | Dale Steyn | 30 | 76 | 2 | 15.00 | 2.36 |
| Hashim Amla | Peter Siddle | 44 | 114 | 2 | 22.00 | 2.31 |
| Jacques Rudolph | Nathan Lyon | 28 | 100 | 4 | 7.00 | 1.68 |
S Rajesh is stats editor of ESPNcricinfo. Follow him on Twitter