The Chris Gayle phenomenon
There are other big hitters in 20-over cricket, but Gayle's stats are far ahead of anyone else's in this format
S Rajesh
18-Mar-2016
Chris Gayle has scored 3025 runs more than the batsman with the next-highest aggregate in T20 cricket since the start of 2011 • ESPNcricinfo Ltd
In September 2007, in the inaugural World T20 game between South Africa and West Indies, Chris Gayle announced to the world his love for the 20-over format, smashing 117 off 57 balls. Eight-and-a-half years later, in Mumbai against a helpless England attack, Gayle confirmed that neither his love for the format nor his abilities have diminished in the slightest, as he eased his way to a 47-ball century, three fewer than what he had required for his hundred in Johannesburg. While the rest of the team laboured to score 67 from 63 balls (strike rate 106), Gayle motored along to 100 from 48 (strike rate 208), and did it with an ease that suggested he wasn't even stretching himself to the limit.
When talking about batting in the 20-over format, there is Chris Gayle, and then there is everyone else. No other batsman has combined the ability to make huge scores consistently with the ability to get them quickly like Gayle has. Since 2011, he has scored 1000-plus T20 runs in every calendar year, and in all except one of those years he has averaged more than 45 at a 145-plus strike rate. He didn't start 2016 so well, scoring only 103 in five innings in the PSL after aggregating 150 from five in the Big Bash, but he has already started to atone for those failures, and looks primed for more runs through the World T20 and the IPL.
His numbers in T20 internationals have also got better in the last few years. Since the start of 2012, his T20I average has increased by ten runs, from 32.47 to 42.33, while the strike rate has remained the same. His striking power has only increased, as is evidenced by a better rate of balls per six, and nine 50-plus scores in 24 T20I innings since 2012 only indicates he has become even better with age.
| Period | Inngs | Runs | Average | SR | 100s/50s | 4s/6s | Balls/ 6 |
| Till Dec 2010 | 51 | 1379 | 29.97 | 134.79 | 1/ 8 | 134/ 74 | 13.82 |
| Jan 2011 onwards | 185 | 7447 | 47.73 | 153.38 | 16/ 47 | 547/ 563 | 8.62 |
| Career | 236 | 8826 | 43.69 | 150.15 | 17/ 55 | 681/ 637 | 9.23 |
| Year | Inngs | Runs | Ave | SR | 100s/ 50s | 4s/ 6s | Balls/6 |
| year 2011 | 31 | 1497 | 57.57 | 174.67 | 4/ 10 | 112/ 116 | 7.39 |
| year 2012 | 38 | 1532 | 47.87 | 151.68 | 3/ 13 | 100/ 121 | 8.35 |
| year 2013 | 33 | 1344 | 49.77 | 149.66 | 3/ 7 | 98/ 100 | 8.98 |
| year 2014 | 36 | 1056 | 32.00 | 120.13 | 2/ 5 | 91/ 60 | 14.65 |
| year 2015 | 36 | 1665 | 59.46 | 164.52 | 3/ 10 | 123/ 135 | 7.50 |
| year 2016 | 11 | 353 | 35.30 | 177.38 | 1/ 2 | 23/ 31 | 6.42 |
| Period | Inngs | Runs | Average | SR | 100s/50s | 4s/6s | Balls/ 6 |
| Till Dec 2011 | 20 | 617 | 32.47 | 144.49 | 1/ 5 | 57/ 34 | 12.56 |
| Jan 2012 onwards | 24 | 899 | 42.33 | 146.45 | 1/ 8 | 70/ 64 | 9.48 |
| Career | 44 | 1506 | 37.65 | 145.64 | 2/ 13 | 127/ 98 | 10.55 |
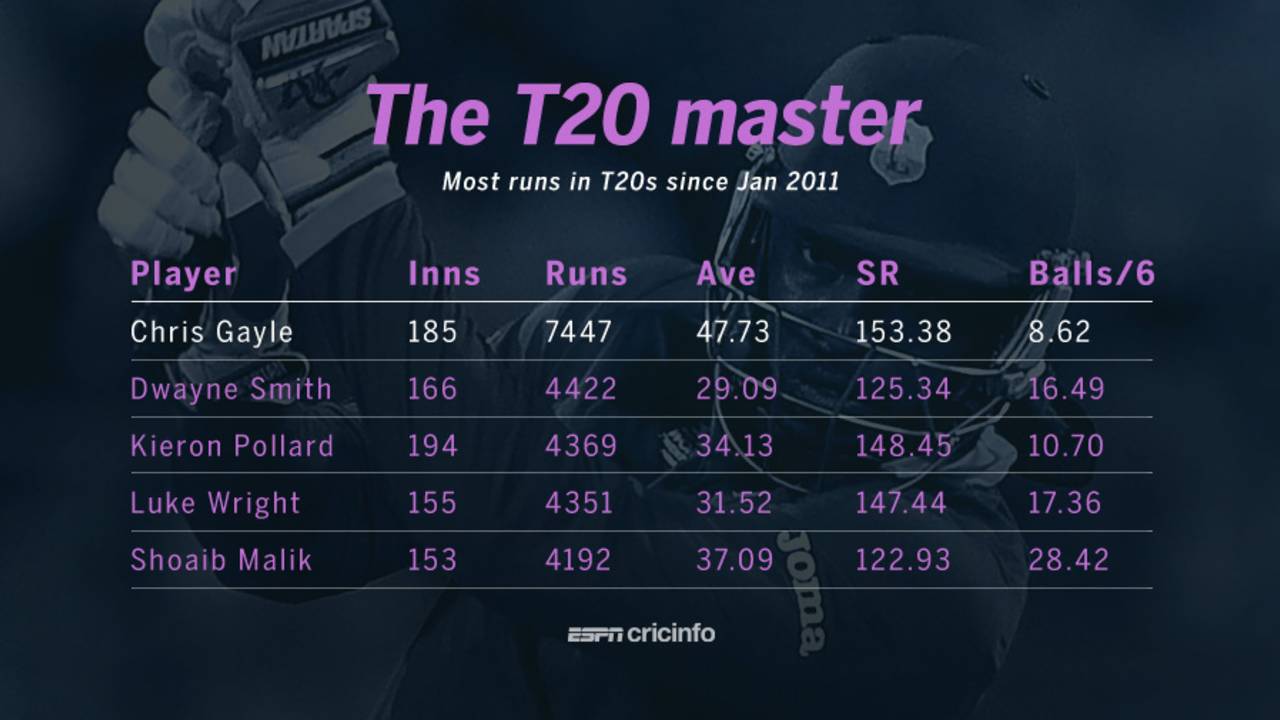
The table below shows how far ahead of everyone else Gayle is in T20s. His aggregate of 7447 is 3025 better than the second highest, his average is more than five runs better than the next best, with a 2500-run cut-off (Virat Kohli's 42.34 is next), while his balls per six is also the best with the same cut-off: Andre Russell is next on 8.83. In terms of strike rate, Russell (167.4) and Glenn Maxwell (155.08) are better than Gayle, but both average less than 25 - obviously their consistency and their run-scoring abilities suffer in their attempt to score quickly. AB de Villiers is the other batsman with a 150-plus strike rate (150.59), but even he averages only 32.25.
In fact, no other batsman - among the 53 who have scored 2500-plus runs during this period - has combined a 40-plus average with a 140-plus strike rate. David Warner (average 38.28, SR 141.09) and MS Dhoni (38.02, 140.28) come closest, while David Miller averages 36.91 at 138.71, and Brad Hodge has an average of 38.48 at a strike rate of 135.49. All these batsmen are fantastic T20 players, but none has mastered the format quite like Gayle has. Since the start of 2011, Gayle has scored 16 centuries; the next best is five, by Michael Klinger and Luke Wright.
| Player | Inns | Runs | Ave | SR | 100 | 50 | 6s | balls/6 |
| CH Gayle | 185 | 7447 | 47.73 | 153.38 | 16 | 47 | 563 | 8.62 |
| DR Smith | 166 | 4422 | 29.09 | 125.34 | 3 | 28 | 214 | 16.49 |
| KA Pollard | 194 | 4369 | 34.13 | 148.45 | 0 | 22 | 275 | 10.70 |
| LJ Wright | 155 | 4351 | 31.52 | 147.44 | 5 | 23 | 170 | 17.36 |
| Shoaib Malik | 153 | 4192 | 37.09 | 122.93 | 0 | 27 | 120 | 28.42 |
| V Kohli | 120 | 4107 | 42.34 | 129.19 | 0 | 33 | 125 | 25.43 |
| LMP Simmons | 136 | 4107 | 33.12 | 116.34 | 1 | 34 | 167 | 21.14 |
| DA Miller | 157 | 4024 | 36.91 | 138.71 | 1 | 21 | 171 | 16.96 |
| RN ten Doeschate | 165 | 3880 | 29.61 | 138.76 | 1 | 20 | 179 | 15.62 |
| SK Raina | 143 | 3841 | 32.27 | 138.06 | 2 | 19 | 143 | 19.45 |
| DA Warner | 116 | 3828 | 38.28 | 141.09 | 4 | 33 | 163 | 16.64 |
In the Mumbai game against England, Gayle scored all of 14 runs in non-boundaries - the other 86 runs came through 11 sixes and five fours. The boundary percentage of 86 is the highest among the 20 centuries scored in T20Is; the next best is 83.76%, by South Africa's Richard Levi, when he scored an unbeaten 117 against New Zealand with 13 sixes and five fours. Gayle makes an appearance again at No. 5 with that 117 in the WT20 opener in 2007, an innings which included ten sixes and seven fours, and had 75% boundary runs.
In the unbeaten 100 against England, Gayle also had the unique distinction of getting all his runs in sixes, fours, or singles. All other 100-plus scores in T20Is have included at least one two or a three, apart from the singles, fours and sixes. Levi, in that unbeaten 117, had 17 singles and one two, apart from the fours and sixes, while McCullum, in his 116 against Australia in 2010, had 17 singles and a three, apart from eight sixes and 12 fours.
| Player | Runs | BF | 4s | 6s | SR | Bound % | Opposition | Year |
| Chris Gayle | 100* | 48 | 5 | 11 | 208.33 | 86.00 | v England | 2016 |
| Richard Levi | 117* | 51 | 5 | 13 | 229.41 | 83.76 | v New Zealand | 2012 |
| Brendon McCullum | 116* | 56 | 12 | 8 | 207.14 | 82.76 | v Australia | 2010 |
| Aaron Finch | 156 | 63 | 11 | 14 | 247.61 | 82.05 | v England | 2013 |
| Chris Gayle | 117 | 57 | 7 | 10 | 205.26 | 75.21 | v South Africa | 2007 |
| Tillakaratne Dilshan | 104* | 57 | 12 | 5 | 182.45 | 75.00 | v Australia | 2011 |
| Mohammad Shahzad | 118* | 67 | 10 | 8 | 176.11 | 74.58 | v Zimbabwe | 2016 |
| Rohit Sharma | 106 | 66 | 12 | 5 | 160.60 | 73.58 | v South Africa | 2015 |
| Martin Guptill | 101* | 69 | 9 | 6 | 146.37 | 71.29 | v South Africa | 2012 |
| Richie Berrington | 100 | 58 | 10 | 5 | 172.41 | 70.00 | v Bangladesh | 2012 |
Gayle's innings in Mumbai was typical of the way he generally bats in T20s: in all games in that format since the start of 2011, Gayle has scored almost 75% of his runs in fours and sixes, easily the highest among the 38 batsmen who have scored at least 2500 runs. The next best is more than four percentage points lower, while there are several others bunched around the mid to late 60s. Gayle his hit ten or more sixes in a T20 innings on 12 occasions; no other batsman has achieved this more than twice. In fact, the total such instances in all T20s are only 40, of which Gayle has 12.
His dot-ball percentage, on the other hand, is among the highest, which isn't surprising either. Among these 38 batsmen, only six batsmen have a higher dot percentage - Dwayne Smith, Lendl Simmons, Michael Lumb, Mohammad Hafeez, Ahmed Shehzad and Shane Watson.
| Batsman | Inns | Runs | SR | Ave | Dot % | Boundary % |
| Chris Gayle | 183 | 7413 | 153.83 | 49.42 | 42.21 | 74.90 |
| Richard Levi | 128 | 3476 | 143.00 | 29.21 | 41.73 | 70.66 |
| Dwayne Smith | 151 | 3981 | 123.83 | 29.27 | 47.62 | 68.63 |
| Shane Watson | 119 | 3429 | 135.83 | 31.17 | 42.53 | 67.13 |
| Brendon McCullum | 109 | 3223 | 136.33 | 32.23 | 40.82 | 66.15 |
| Michael Lumb | 104 | 2573 | 134.00 | 25.98 | 44.92 | 66.07 |
| Glenn Maxwell | 134 | 2787 | 155.33 | 23.03 | 35.25 | 65.66 |
| Luke Wright | 129 | 3719 | 147.83 | 32.91 | 35.94 | 65.34 |
| Quinton de Kock | 95 | 2921 | 134.83 | 33.96 | 40.62 | 65.32 |
| Kieron Pollard | 181 | 4036 | 146.67 | 34.20 | 36.24 | 64.42 |
Gayle's power hitting is the most prominent aspect of his batting, but what's also impressive is the way he plans his innings and often bats deep into the innings when he gets starts. His averages at each of the three stages of a T20 innings - the Powerplays, the middle overs and the slog - are superb, but he also builds up the tempo gradually, going at a strike rate of 137 in the Powerplays, before lifting it up to 163 in the middle overs and 220 at the slog.
| Over range | Average | Strike rate |
| First 6 | 45.24 | 137.00 |
| 6.1 to 15.0 | 57.20 | 163.16 |
| Last 5 | 44.21 | 219.83 |
Gayle is a complete T20 batsman in terms of his scoring rates at various stages of an innings, and also in terms of his stats against different types of bowlers. Quality offspinners have troubled him - Harbhajan Singh has dismissed him four times in T20s conceding only 54 from 59 balls, Mohammad Hafeez has got him four times for 17 runs in 30 balls, while R Ashwin has dismissed him three times for 50 off 66 balls. Overall, though, his stats against different bowler types are pretty handy, with a particular preference for left-arm spin.
| Bowler type | Average | Strike rate |
| Right-arm pace | 46.47 | 149.83 |
| Left-arm pace | 53.86 | 145.16 |
| Right-arm spin | 43.09 | 145.00 |
| Left-arm spin | 146.40 | 243.16 |
The one aspect of his T20 batting that isn't quite sparkling is his performances in tournament finals: in five such innings he has scored 61 runs at an average of 15.25 and a strike rate of 68.53. His best is an unbeaten 47 off 48 in the CPL final in 2013, but before that effort he had scored 3 off 16 in the 2012 World T20 final, 5 off 12 in the 2011 Champions League final, 0 off 3 in the 2011 IPL final, and 6 off 10 in the 2008 Stanford 20/20 final. Gayle would probably like nothing better than an opportunity to correct those numbers in a couple of weeks' time.
S Rajesh is stats editor of ESPNcricinfo. Follow him on Twitter