Is home advantage on the rise?
Home teams have been increasingly dominant in Tests over the last few years, but that trend has been especially visible when Asian teams travel overseas, and non-Asian teams come to Asia
S Rajesh
04-Nov-2016
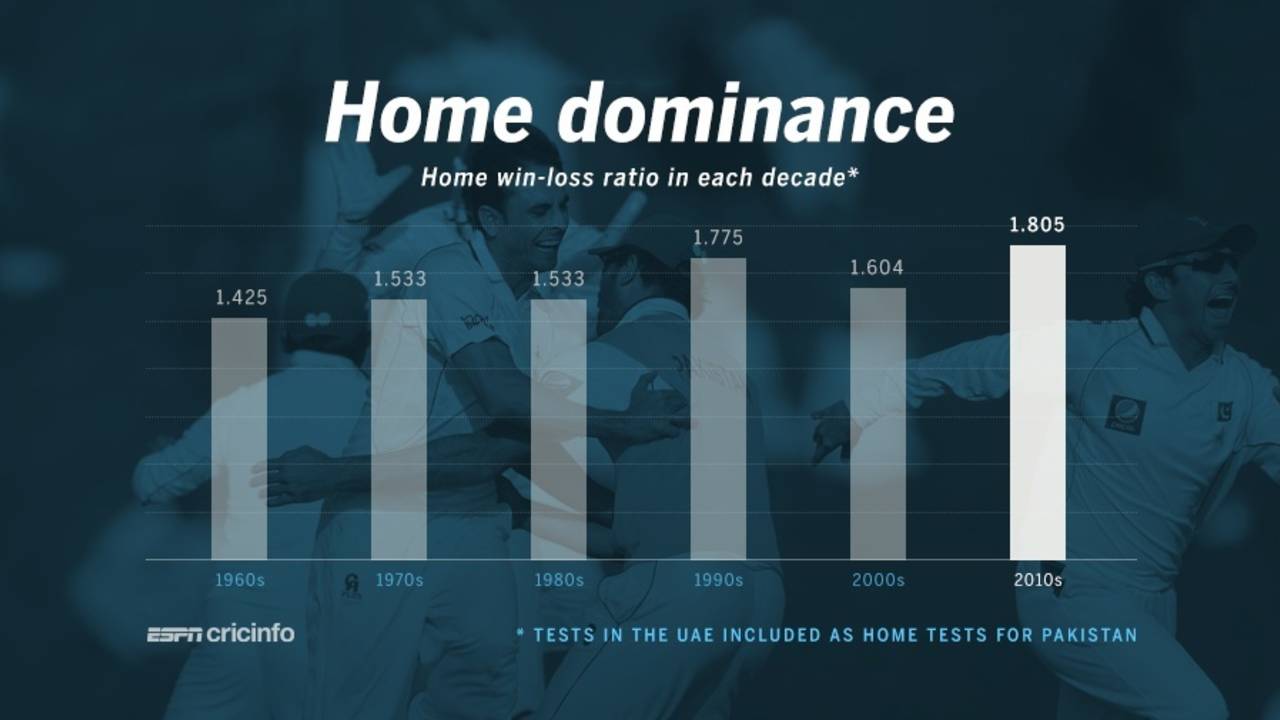
The win-loss ratio for home teams in Tests since 2010 is higher than in any other previous decade • ESPNcricinfo Ltd
Notwithstanding the results over the last couple of days, when Sri Lanka beat Zimbabwe and West Indies notched up a rare away against Pakistan, home teams have been enjoying plenty of success in Test cricket recently. Sri Lanka pummelled Australia 3-0, India were similarly dominant against New Zealand, and Bangladesh got one past England. There have been a few strong performances by overseas teams too over the last year - Pakistan drew in England, Australia won in New Zealand and England beat South Africa, but is it fair to say that home teams are doing better now than they used to? Here's what the numbers indicate.
In this decade, the overall win-loss ratio for home teams is 1.805, which is the highest it has ever been in a decade after the 1870s. (Tests in the UAE have been considered home games for Pakistan.) It has been fairly high over the last couple of decades, but since the start of 2010, it has been inching closer to two wins per defeat.
A team-wise look at the home numbers shows India's dominance at home during this period. In away Tests since 2010 they have won ten and lost 18, but at home they have been unstoppable, winning 21 and losing just three, two of which were in the series defeat against England in 2012-13. Australia and Pakistan have impressive win-loss ratios of more than three as well. The difference between the batting and bowling averages is more than ten for four of these teams, which is another strong indicator of home dominance.
| Team | Mat | Won | Lost | W/L | Ave | Bowl ave | Diff |
| India | 29 | 21 | 3 | 7.00 | 40.93 | 27.61 | 13.32 |
| Australia | 34 | 22 | 5 | 4.40 | 43.85 | 29.92 | 13.93 |
| Pakistan | 24 | 13 | 4 | 3.25 | 40.38 | 32.56 | 7.82 |
| England | 47 | 28 | 10 | 2.80 | 38.89 | 28.82 | 10.07 |
| South Africa | 29 | 16 | 7 | 2.28 | 38.93 | 27.14 | 11.79 |
| Sri Lanka | 33 | 14 | 9 | 1.55 | 34.24 | 31.87 | 2.37 |
| New Zealand | 23 | 9 | 6 | 1.50 | 36.98 | 34.17 | 2.81 |
| West Indies | 29 | 9 | 13 | 0.69 | 28.46 | 32.02 | -3.56 |
| Zimbabwe | 11 | 3 | 7 | 0.43 | 28.08 | 38.16 | -10.08 |
| Bangladesh | 24 | 4 | 12 | 0.33 | 32.82 | 45.44 | -12.62 |
The table above also has a distinct split between the top seven teams and the bottom three. The top seven all have a win-loss ratio of 1.5 or more in home Tests since the start of 2010, while West Indies, Bangladesh and Zimbabwe - the bottom three - have ratios of lower of 0.70. Combining the numbers for the top seven teams, they have a ratio of nearly three wins per defeat at home, while the bottom three have lost twice as many as they have won.
| Teams | Mat | Won | Lost | Draw | W/L | Bat ave | Bowl ave | Diff |
| Top 7 teams | 219 | 123 | 44 | 52 | 2.80 | 39.10 | 29.97 | 9.13 |
| Bottom 3 teams | 64 | 16 | 32 | 15 | 0.5 | 29.99 | 37.56 | -7.57 |
Apart from the weak numbers of the bottom three teams - though Bangladesh have shown strong evidence recently that they are ready to mix it with the bigger boys even in Test cricket - what stands out in recent years is the inability of teams to win Test matches in unfamiliar conditions. India winning in Sri Lanka isn't a surprise, and neither is Australia winning in New Zealand unexpected, but teams from outside the subcontinent have all struggled when they have travelled to Asia, just as Asian teams have come a cropper in series in Australia, England, New Zealand and South Africa.
The graph below clearly shows the rise in home dominance when the three top Asian teams have played in home conditions against the non-subcontinent teams; there are similar one-sided numbers when Australia, England, New Zealand or South Africa have played at home against the top three Asian sides. New Zealand weren't so dominant historically, but since 2010 they have a 5-1 record against these Asian teams, winning four Tests against Sri Lanka and one against India. In the 1970s, '80s and '90s, the overseas teams were more competitive both in Asia and outside, but over the last seven years, the numbers have increasingly become more skewed.
Among the three Asian teams, Pakistan have the best win-loss record in these countries during this period, but even they have a win-loss of 4-10. India have been poor, losing 16 and winning just two, while Sri Lanka have a 2-12 record.
| Team | Mat | Won | Lost | W/L | Bat ave | Bowl ave | Diff |
| Pakistan | 15 | 4 | 10 | 0.40 | 24.58 | 34.49 | -9.91 |
| Sri Lanka | 18 | 2 | 12 | 0.17 | 27.38 | 44.39 | -17.01 |
| India | 24 | 2 | 16 | 0.13 | 28.78 | 47.70 | -18.92 |
Similarly, the non-Asian teams have struggled in Asia. South Africa had a superb record there before their 3-0 drubbing in India, while England beat India 2-1 but have lost five out of six Tests in the UAE. West Indies did their numbers no harm with a win in Sharjah, but Australia's stats in Asia are terrible - one win, 11 defeats in 14 Tests.
| Team | Mat | Won | Lost | W/ L | Bat ave | Bowl ave | Diff |
| South Africa | 12 | 3 | 5 | 0.60 | 31.15 | 33.40 | -2.25 |
| England | 12 | 3 | 7 | 0.43 | 30.49 | 31.43 | -0.94 |
| New Zealand | 13 | 2 | 8 | 0.25 | 28.33 | 43.62 | -15.29 |
| West Indies | 13 | 1 | 8 | 0.13 | 27.80 | 41.31 | -13.51 |
| Australia | 14 | 1 | 11 | 0.09 | 27.37 | 39.68 | -12.31 |
A look at the numbers for the main batsmen from each team reveal the home bias for most of them. Among the Asian batsmen, Azhar Ali, Misbah-ul-Haq and Cheteshwar Pujara have done significantly better at home, with a difference of more than 20 between their home and away averages. (UAE counted as home Tests for Pakistan; away Tests includes games played in Australia, England, New Zealand and South Africa.) Virat Kohli and Dimuth Karunaratne have higher overseas averages, but Karunaratne has ordinary numbers both home and away.
Among batsmen from outside Asia, the difference in averages stand out for the two Australian batsmen, David Warner and Steven Smith - they are both outstanding at home but not so hot in Asia. (All Asia numbers exclude Tests in Bangladesh.) At the other end of the spectrum are Darren Bravo, Alastair Cook and Hashim Amla - the numbers for the last two are particularly impressive as they are strong at home, but even better in Asia.
| Player | Away Tests | Average | 100s | Home Tests | Average | 100s | Ave diff |
| Dimuth Karunaratne | 12 | 31.86 | 1 | 14 | 29.30 | 2 | 2.56 |
| Virat Kohli | 17 | 48.84 | 7 | 20 | 47.17 | 4 | 1.67 |
| Ajinkya Rahane | 13 | 48.59 | 3 | 8 | 51.75 | 3 | -3.16 |
| Murali Vijay | 14 | 39.57 | 2 | 16 | 42.84 | 3 | -3.27 |
| Dinesh Chandimal | 10 | 40.55 | 1 | 16 | 47.50 | 5 | -6.95 |
| Kaushal Silva | 8 | 28.00 | 0 | 15 | 38.36 | 2 | -10.36 |
| Younis Khan | 9 | 43.81 | 2 | 23 | 58.40 | 10 | -14.59 |
| Angelo Mathews | 15 | 34.17 | 2 | 32 | 52.40 | 4 | -18.23 |
| Cheteshwar Pujara | 14 | 29.40 | 1 | 20 | 53.03 | 6 | -23.63 |
| Misbah-ul-Haq | 10 | 38.76 | 1 | 24 | 65.66 | 6 | -26.90 |
| Azhar Ali | 13 | 29.60 | 1 | 20 | 57.88 | 6 | -28.28 |
| Player | Away Tests | Average | 100s | Home Tests | Average | 100s | Ave diff |
| Darren Bravo | 13 | 49.00 | 3 | 24 | 29.35 | 1 | 19.65 |
| Hashim Amla | 11 | 74.81 | 6 | 29 | 58.11 | 8 | 16.70 |
| Alastair Cook | 12 | 63.23 | 4 | 47 | 47.77 | 8 | 15.46 |
| Kraigg Brathwaite | 8 | 44.64 | 1 | 17 | 35.93 | 3 | 8.71 |
| AB de Villiers | 12 | 54.10 | 2 | 27 | 60.20 | 8 | -6.10 |
| Kane Williamson | 12 | 40.22 | 3 | 19 | 57.51 | 4 | -17.29 |
| Ross Taylor | 13 | 33.75 | 3 | 20 | 53.78 | 5 | -20.03 |
| Faf du Plessis | 8 | 19.23 | 0 | 18 | 43.42 | 4 | -24.19 |
| Steven Smith | 7 | 41.57 | 1 | 18 | 67.30 | 8 | -25.73 |
| David Warner | 9 | 33.16 | 1 | 27 | 60.56 | 12 | -27.40 |
Among the bowlers, the gap between home and away averages for India's top bowlers is especially glaring, and a big reason why the team has been so impressive at home but failed to win much overseas. The difference between home and away averages is 36.21 for R Ashwin, 28.63 for Ravindra Jadeja, and 19.77 for Mohammed Shami. Similarly, Rangana Herath has been exceptional at home, but averages more than 42 overseas. On the other hand, James Anderson and Dale Steyn have been stellar in Asian conditions.
With England and Australia both touring India for Tests this season, and Pakistan scheduled to play in New Zealand and Australia, there is plenty of opportunity to Asian and non-Asian teams to buck the recent trend. Hopefully, the results in these matches will be less predictable than what we have come to expect over the last few years.
| Player | Away Tests | Wickets | Ave | Home Tests | Wickets | Average | Ave diff |
| Nuwan Pradeep | 9 | 31 | 37.90 | 9 | 18 | 44.16 | 6.26 |
| Suranga Lakmal | 10 | 23 | 51.21 | 12 | 18 | 56.50 | 5.29 |
| Ishant Sharma | 21 | 66 | 44.43 | 16 | 30 | 42.83 | -1.60 |
| Wahab Riaz | 7 | 21 | 34.47 | 6 | 20 | 32.70 | -1.77 |
| Bhuvneshwar Kumar | 6 | 20 | 33.70 | 7 | 15 | 27.80 | -5.90 |
| Yasir Shah | 4 | 19 | 40.73 | 10 | 63 | 25.34 | -15.39 |
| Umesh Yadav | 7 | 25 | 43.96 | 9 | 25 | 26.92 | -17.04 |
| Mohammed Shami | 10 | 36 | 42.13 | 5 | 19 | 22.36 | -19.77 |
| Rangana Herath | 17 | 48 | 42.27 | 28 | 153 | 20.37 | -21.90 |
| Ravindra Jadeja | 7 | 18 | 46.16 | 12 | 64 | 17.53 | -28.63 |
| R Ashwin | 9 | 24 | 56.58 | 22 | 153 | 20.37 | -36.21 |
| Player | Away Tests | Wickets | Average | Home Tests | Wickets | Average | Ave diff |
| James Anderson | 12 | 43 | 23.51 | 42 | 192 | 23.10 | -0.41 |
| Nathan Lyon | 11 | 42 | 42.57 | 26 | 101 | 31.97 | -10.60 |
| Dale Steyn | 9 | 38 | 24.71 | 26 | 141 | 19.00 | -5.71 |
| Morne Morkel | 11 | 33 | 28.63 | 26 | 95 | 27.62 | -1.01 |
| Trent Boult | 10 | 32 | 30.50 | 16 | 67 | 26.92 | -3.58 |
| Tim Southee | 8 | 29 | 26.86 | 21 | 77 | 29.96 | 3.10 |
| Mitchell Starc | 6 | 28 | 25.21 | 11 | 46 | 28.69 | 3.48 |
| Imran Tahir | 7 | 26 | 29.42 | 7 | 19 | 38.89 | 9.47 |
| Stuart Broad | 9 | 22 | 32.63 | 44 | 191 | 24.68 | -7.95 |
| Vernon Philander | 5 | 11 | 31.90 | 18 | 79 | 19.89 | -12.01 |
S Rajesh is stats editor of ESPNcricinfo. Follow him on Twitter.