India's first fast-bowling match-winner
Kapil Dev overcame huge odds to become one of the leading fast bowlers of his era. Most impressively, he was at his best against the best team of his time
S Rajesh
14-Mar-2010
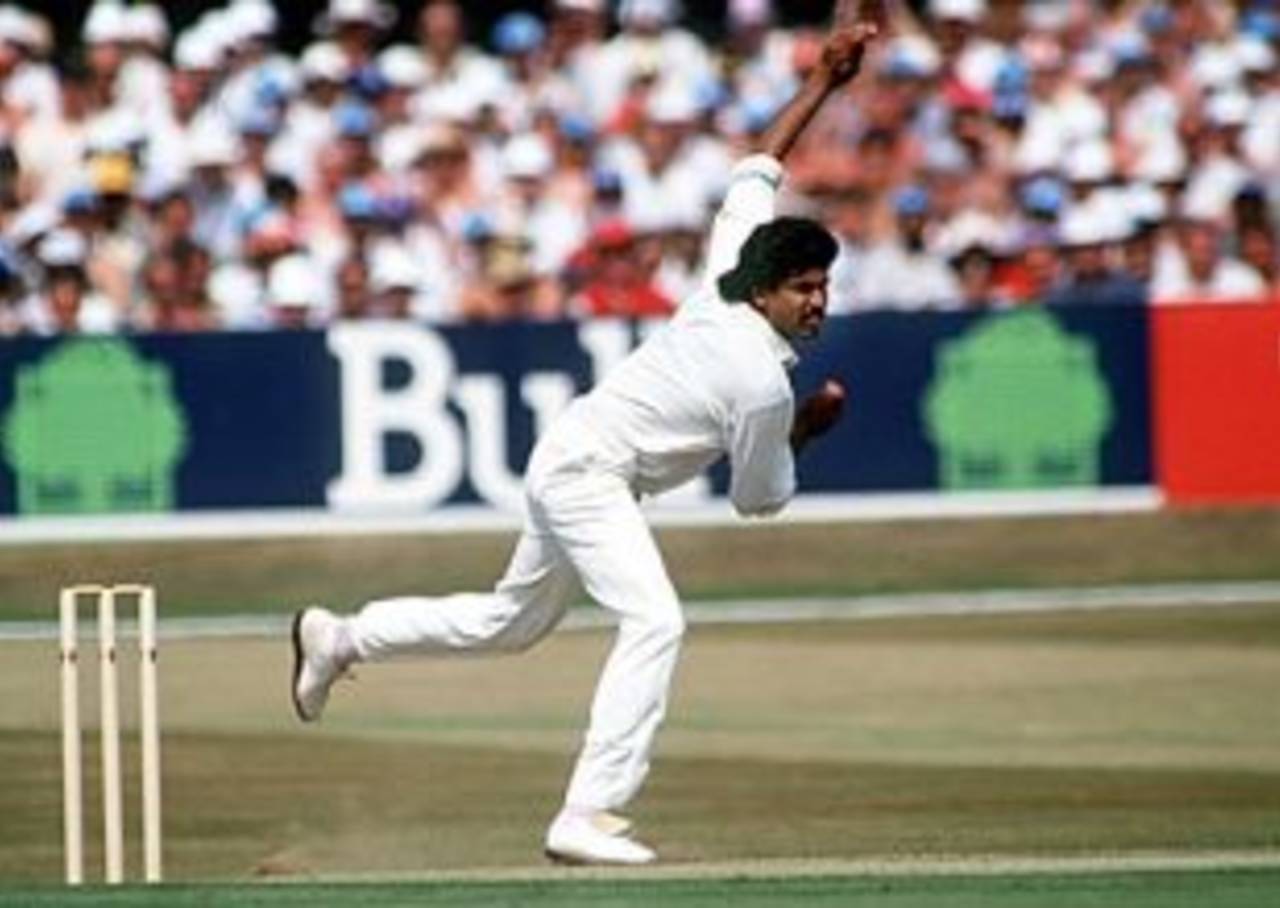
Kapil Dev was at his best against West Indies, taking 89 Test wickets at less than 23 each • Bob Thomas/Getty Images
For a nation starved of fast bowlers, the advent of Kapil Dev was a godsend. His batting was pretty handy as well, but there's little doubt that his major contribution was as a pace bowler, offering India an attacking option with the new ball that they had sorely lacked till then.
If the task of bowling fast on flat pitches wore Kapil down, he did remarkably well to camouflage that wear and tear over an international career that stretched 16 years.
He announced himself in no uncertain terms in his first series, exhibiting pace and aggression hitherto unseen among Indian bowlers, but in statistical terms the returns from that series were meagre - seven wickets at an average of more than 60. In his first 10 Tests, he conceded more than 39 runs per wicket, and his batting was a stronger suit than his bowling. Sixteen wickets in four Tests against England started the golden run with the ball, and he followed that with 28 wickets in the home series against Australia and 32 in six Tests against Pakistan at an average of less than 18.
Those performances signalled a peak in Kapil's bowling career, when the pace was sharp, the outswinger working to perfection, and the wickets coming his way at a quick rate. In the 13 series he played between July 1979 and December 1983, Kapil's bowling average went beyond 32 in only three series, while seven times he averaged less than 26. That was also the period when he averaged more than four wickets per Test, and took a five-for 17 times in 52 Tests.
He still turned in lion-hearted performances with the ball after that, but not with the same consistency: in 69 Tests from the beginning of 1984, Kapil's wicket tally dropped to 2.7 per Test, and he also went an entire series - three Tests against Australia at home in 1986 - without a wicket. His batting, though, went up a notch, thus ensuring that his batting average was higher than his bowling average in each of those three periods of his Test career. Of his eight Test centuries, five came during this phase.
| Period | Runs | Average | 100s | Wickets | Average | 5WI |
| First ten Tests | 510 | 42.50 | 1 | 29 | 39.06 | 1 |
| Next 52 Tests | 1973 | 27.40 | 2 | 218 | 26.19 | 17 |
| Next 69 Tests | 2765 | 32.52 | 5 | 187 | 32.20 | 5 |
| Career | 5248 | 31.05 | 8 | 434 | 29.64 | 23 |
Kapil's best phase as an ODI bowler coincided with two famous victories in world events for India. During the period between May 1983 and March 1986, when India won the World Cup and the World Championship of Cricket, he averaged 31.25 with the bat and 20.39 with the ball, taking 69 wickets in 47 games. His performances remained impressive till the early 1990s, but in the last couple of years of his career his numbers fell away alarmingly: in 36 matches he averaged 13.50 with the bat and more than 37 with the ball. The only aspect that wasn't affected was his economy rate, which remained well below four runs per over.
Towards the beginning of the 1990s, the positive difference between his batting and bowling averages also began to close. Through most of the 1980s his batting average was more than the corresponding one for bowling, but the last time this happened was on December 15, 1991,when, after his 176th ODI, his batting average was 0.13 higher. As he neared the end of his career, his batting and bowling prowess both decreased, and he ended with a batting average almost four runs lower than the bowling one. (Click here for his cumulative ODI averages.)
| Period | ODIs | Runs | Average | Strike rate | Wickets | Average | Econ rate |
| Till April 1983 | 32 | 608 | 20.96 | 107.80 | 34 | 31.20 | 3.78 |
| May 1983 to Feb 1986 | 47 | 1000 | 31.25 | 98.91 | 69 | 20.39 | 3.51 |
| March 1986 to March 1992 | 110 | 1878 | 24.71 | 93.75 | 123 | 28.17 | 3.81 |
| Since April 1992 | 36 | 297 | 13.50 | 74.06 | 27 | 37.48 | 3.62 |
| Career | 225 | 3783 | 23.79 | 95.07 | 253 | 27.45 | 3.71 |
Kapil's overall numbers are impressive enough, but what stands out are his bowling stats against the best team of his generation. In 25 Tests against West Indies, Kapil took 89 wickets, which is his second-highest against a single team (he took 99 against Pakistan). The average of 24.89 is his best against any team, marginally better than the 25.35 he averaged in 20 Tests against Australia.
In the 1980s, Kapil was among the best bowlers against a line-up that included Viv Richards, Clive Lloyd, Gordon Greenidge, Desmond Haynes and Richie Richardson. He dismissed Greenidge eight times in Tests, and Haynes, Richards and Dujon seven times each. (Click here for more details.) In 19 Tests, Kapil's bowling average against West Indies was less than 23; among those who bowled at least 1200 deliveries against them during this period, only Imran Khan and Richard Hadlee, the two other great allrounders of the era, had better bowling averages. Ian Botham's numbers were a huge contrast to those of the three other allrounders, though: in 19 Tests he took only 58 wickets at an average of almost 36.
| Bowler | Tests | Wickets | Average | Strike rate | 5WI/10WM |
| Imran Khan | 10 | 52 | 16.68 | 38.3 | 5/ 1 |
| Richard Hadlee | 10 | 51 | 22.03 | 49.1 | 4/ 1 |
| Kapil Dev | 19 | 72 | 22.98 | 51.4 | 4/ 1 |
| Abdul Qadir | 8 | 40 | 28.07 | 55.2 | 1/ 0 |
| Graham Dilley | 11 | 36 | 28.77 | 56.6 | 1/ 0 |
| Ewen Chatfield | 7 | 23 | 31.43 | 69.5 | 1/ 1 |
| Geoff Lawson | 12 | 39 | 35.58 | 65.0 | 2/ 1 |
| Ian Botham | 19 | 58 | 35.84 | 59.4 | 3/ 0 |
| John Emburey | 14 | 30 | 39.26 | 87.9 | 2/ 0 |
| Rodney Hogg | 8 | 20 | 42.15 | 77.1 | 1/ 0 |
India won only 24 of the 131 Tests that Kapil played, which indicates the team's overall lack of strength. For almost his entire career, he didn't have consistent fast-bowling support at the other end, which was the main reason why he was involved in only four Test wins overseas, two of which came in the same series, against England in 1986.
Overall, Kapil averaged 18.30 in Test wins, which is next only to Erapalli Prasanna and Bishan Bedi among Indian bowlers who took at least 50 wickets in wins. However, Kapil only took 90 wickets in these 24 matches - fewer than four per Test - which suggests other bowlers, especially spinners when playing at home, had a large role to play in India's wins.
| Bowler | Tests | Wickets | Average | Strike rate | 5WI/ 10WM |
| Erapalli Prasanna | 15 | 81 | 17.61 | 50.4 | 5/ 1 |
| Bishan Bedi | 17 | 97 | 17.65 | 54.0 | 6/ 0 |
| Kapil Dev | 24 | 90 | 18.30 | 45.2 | 3/ 1 |
| Anil Kumble | 43 | 288 | 18.75 | 44.4 | 20/ 5 |
| BS Chandrasekhar | 14 | 98 | 19.27 | 45.4 | 8/ 1 |
| Javagal Srinath | 17 | 68 | 20.30 | 48.7 | 2/ 0 |
Apart from his obvious skills as a bowler, Kapil was a more-than-handy batsman down the order. He batted at No.7 through most of his career, averaging a touch over 31, but his stats at No. 8, where he batted 58 times, are among the best for batsmen who've batted at that slot. With a cut-off of 40 innings at that position, only two - Daniel Vettori and Mark Boucher - have a better batting average at that number.
| Batsman | Innings | Runs | Average | 100s/ 50s |
| Daniel Vettori | 60 | 2072 | 42.28 | 3/ 13 |
| Mark Boucher | 41 | 1148 | 35.87 | 2/ 7 |
| Kapil Dev | 58 | 1777 | 33.52 | 2/ 11 |
| Shaun Pollock | 79 | 1796 | 30.96 | 0/ 6 |
| Syed Kirmani | 43 | 1030 | 28.61 | 1/ 4 |
| Richard Hadlee | 53 | 1235 | 27.44 | 1/ 6 |
The aspect of his ODI bowling that stands out best is his economy rate. Admittedly, Kapil played in an era when ODI scores hadn't reached the astronomical heights they have today, but even among his contemporaries, his economy rate was among the best.
Of the 212 games in which he bowled at least five overs, 63 times he conceded fewer than three runs per over, which is 30% of those matches. Similarly, in another 32% his economy rate was between three and four. Only 34 times did he go at five or more per over.
His best performance, in terms of economy rate, was against West Indies in Port-of-Spain in 1989, when he conceded only four runs in seven overs. West Indies won that match comfortably, though. Against Australia in Perth in 1991, he had figures of 1 for 5 in six overs. Those are the only two instances of his conceding less than one run per over. At the other end of the spectrum was his performance against Pakistan in Lahore in 1982, when he conceded 73 in seven in a shortened game.
| Econ rate < 3 | Econ rate>=3 and <4 | Econ rate >=4 and <5 | Econ rate >=5 and <6 | Econ rate >=6 | |
| Number of matches | 63 | 68 | 47 | 24 | 10 |
Among bowlers who bowled at least 5000 deliveries during the period in which Kapil played ODIs, only six have a better economy rate. Among his three rival allrounders, Richard Hadlee has a lower economy rate, while the rates for Imran and Botham are slightly higher.
| Bowler | ODIs | Wkts | Average | Econ rate |
| Joel Garner | 96 | 140 | 19.25 | 3.09 |
| Richard Hadlee | 102 | 147 | 20.22 | 3.26 |
| Michael Holding | 99 | 140 | 20.97 | 3.31 |
| Curtly Ambrose | 104 | 151 | 21.50 | 3.49 |
| Malcolm Marshall | 136 | 157 | 26.96 | 3.53 |
| Ewen Chatfield | 114 | 140 | 25.84 | 3.57 |
| Kapil Dev | 225 | 253 | 27.45 | 3.71 |
| Wasim Akram | 181 | 262 | 22.48 | 3.78 |
| Courtney Walsh | 129 | 140 | 30.97 | 3.80 |
| Imran Khan | 169 | 173 | 26.91 | 3.90 |
| Ian Botham | 107 | 134 | 28.81 | 3.96 |
S Rajesh is stats editor of Cricinfo