Records galore for Ponting the captain
No other captain has won as many international matches as Ricky Ponting
S Rajesh
29-Mar-2011
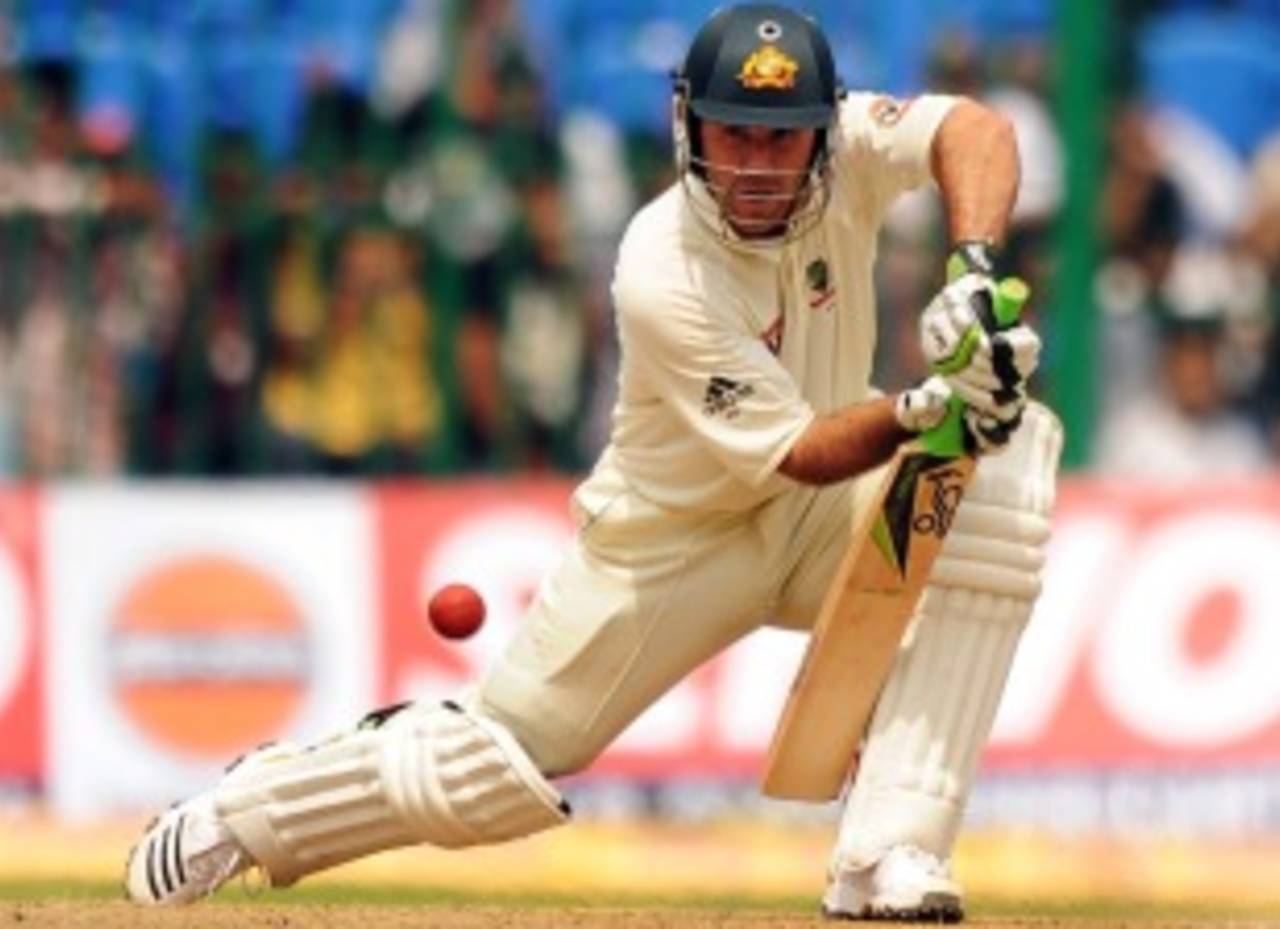
Ricky Ponting is the only captain to score hundreds in each innings of a Test on three occasions; no other captain has done it more than once • AFP
With 219 wins in the 322 matches in which he led Australia, Ricky Ponting is easily the most successful captain in the history of international cricket. The two World Cups triumphs - in 2003 and 2007 - two Champions Trophies, and a 5-0 drubbing of England in the Ashes home series in 2006-07 were the most prominent results he achieved as captain, but there were several other notable ones too, during a period when Australia won much more than they lost.
And through all the rigours of captaincy, Ponting ensured that his batting remained largely unaffected - his Test average fell only marginally during the period when he was captain, while his ODI stats improved. In the 77 Tests in which he led, Ponting averaged 51.51, which isn't far away from his average of 55.97 when he wasn't captain. In ODIs, he averaged 43.30 as captain, and 41.37 otherwise. It also helped that through most of Ponting's tenure as leader, he was the best batsman of the side, with the ability to either convert on a strong start from his No.3 slot, or consolidate and rebuild after the loss of an early wicket.
Among captains who've led in at least 50 Tests, Ponting's win-loss ratio of 3.00 is next only to those of his predecessor Steve Waugh (who won 41 and lost only nine), and Viv Richards (win-loss ratio of 3.37). Clive Lloyd is the other captain with a ratio of 3, winning 36 and losing 12. Five of Ponting's 16 losses came in his last seven Tests, during which period Australia won only once. That means Ponting's win-loss record after the victory against Pakistan at Lord's last year was 47-11, a ratio of 4.27.
In ODIs, though, Ponting's record stays the best despite defeats in his last two games as captain. In fact, the gulf between the top two and the rest is huge: Ponting's win-loss was 3.28, Hansie Cronje's was 2.82, but none of the others touched 2. Of the 29 games he captained in the World Cup, Australia won 26, tied one, and lost only two. In fact, of the 34-match unbeaten run that Australia enjoyed in World Cups, 27 came during Ponting's captaincy.
| Captain | Tests | Wins | Losses | Draws | W/L ratio |
| Steve Waugh | 57 | 41 | 9 | 7 | 4.55 |
| Viv Richards | 50 | 27 | 8 | 15 | 3.37 |
| Clive Lloyd | 74 | 36 | 12 | 26 | 3.00 |
| Ricky Ponting | 77 | 48 | 16 | 13 | 3.00 |
| Hansie Cronje | 53 | 27 | 11 | 15 | 2.45 |
| Michael Vaughan | 51 | 26 | 11 | 14 | 2.36 |
| Captain | ODIs | Wins | Losses | W/L ratio |
| Ricky Ponting | 228 | 164 | 50 | 3.28 |
| Hansie Cronje | 138 | 99 | 35 | 2.82 |
| Steve Waugh | 106 | 67 | 35 | 1.91 |
| Viv Richards | 105 | 67 | 36 | 1.86 |
| Graeme Smith | 150 | 92 | 51 | 1.80 |
| MS Dhoni | 100 | 57 | 35 | 1.62 |
As mentioned earlier, Ponting's batting stats as captain are pretty impressive. The only aspect that's slightly disappointing is his conversion rate as captain: out of the 54 times he topped 50, his century count was only 19.
| Matches | Runs | Average | Strike rate | 100s/ 50s | |
| Tests - as captain | 77 | 6542 | 51.51 | 60.62 | 19/ 35 |
| Tests - as batsman | 75 | 5821 | 55.97 | 58.00 | 20/ 21 |
| ODIs - as captain | 228 | 8488 | 43.30 | 83.61 | 22/ 51 |
| ODIs - as batsman | 131 | 4800 | 41.37 | 75.48 | 8/ 28 |
A question of personnel
Ponting's captaincy record is exceptional, but those who question his tactical nous claim the wins were largely because of an exceptional team who needed little leadership. Glenn McGrath, Shane Warne, Matthew Hayden were the three top-class players who were around through the first third of Ponting's captaincy career, but none of them were there through the last third. The contrast in the numbers is stark: in the 24 Tests when the trio was around, Ponting averaged almost 79, scored ten centuries, and Australia had a 19-0 win-loss record. When the trio departed, Ponting's average dropped to almost half, his rate of converting fifties into centuries diminished visibly, and Australia lost far more often.
Ponting's captaincy record is exceptional, but those who question his tactical nous claim the wins were largely because of an exceptional team who needed little leadership. Glenn McGrath, Shane Warne, Matthew Hayden were the three top-class players who were around through the first third of Ponting's captaincy career, but none of them were there through the last third. The contrast in the numbers is stark: in the 24 Tests when the trio was around, Ponting averaged almost 79, scored ten centuries, and Australia had a 19-0 win-loss record. When the trio departed, Ponting's average dropped to almost half, his rate of converting fifties into centuries diminished visibly, and Australia lost far more often.
The team results were obviously likely to worsen, but what would have been far more disappointing for Ponting are his own batting stats - his form dropped away just when the team needed him more.
| Tests | Runs | Average | 100s/ 50s | Wins/losses | |
| With Hayden, McGrath, Warne | 24 | 2677 | 78.73 | 10/ 11 | 19/ 0 |
| Without Hayden, McGrath, Warne | 28 | 2001 | 40.02 | 3/ 13 | 14/ 9 |
In ODIs, McGrath and Hayden were the two who played through the first third of Ponting's captaincy career. Australia's win-loss ratio went down significantly after they left, but Ponting's batting stats didn't suffer as much as they did in Tests. His conversion rate, though, dropped in ODIs too.
| ODIs | Runs | Average | Strike rate | 100s/ 50s | Wins/ losses | |
| With Hayden & McGrath | 73 | 2601 | 46.44 | 84.33 | 6/ 14 | 59/ 10 |
| Without Hayden & McGrath | 84 | 3326 | 41.57 | 83.37 | 6/ 25 | 54/ 25 |
Leading by example
Overall, though, Ponting's batting stats as captain are still exceptional: he is one of only seven batsmen to score more than 4000 Test runs as captain. Among those seven, only Brian Lara and Greg Chappell have a higher average. Ponting is also the only captain to score a century in each innings of a Test on three occasions; it's a feat that's only happened 13 times in Test history, and no other captain has done it more than once.
Overall, though, Ponting's batting stats as captain are still exceptional: he is one of only seven batsmen to score more than 4000 Test runs as captain. Among those seven, only Brian Lara and Greg Chappell have a higher average. Ponting is also the only captain to score a century in each innings of a Test on three occasions; it's a feat that's only happened 13 times in Test history, and no other captain has done it more than once.
| Batsman | Tests | Runs | Average | 100s/ 50s |
| Brian Lara | 47 | 4685 | 57.83 | 14/ 19 |
| Greg Chappell | 48 | 4209 | 55.38 | 13/ 19 |
| Ricky Ponting | 77 | 6542 | 51.51 | 19/ 35 |
| Clive Lloyd | 74 | 5233 | 51.30 | 14/ 27 |
| Allan Border | 93 | 6623 | 50.94 | 15/ 36 |
| Graeme Smith | 83 | 6851 | 49.28 | 20/ 27 |
| Stephen Fleming | 80 | 5156 | 40.59 | 8/ 31 |
In ODIs, no captain comes close to Ponting's tally of 8488 runs: the next-best is Stephen Fleming with 6295. Ponting's 22 centuries is twice the tally of the second-best, Sourav Ganguly. Twenty of those hundreds came in winning causes; the two which didn't were his 164 in that ODI against South Africa in Johannesburg, and his 104 against India in the World Cup defeat in Ahmedabad. He has scored 6977 ODI runs in wins, which is more than 3000 ahead of the next-best.
S Rajesh is stats editor of ESPNcricinfo. With inputs from Madhusudhan Ramakrishnan.