A stronghold for England and Monty Panesar
England have won six of their last seven Tests at this ground, while Panesar has 25 wickets from three Tests
S Rajesh
Jul 31, 2013, 8:57 AM
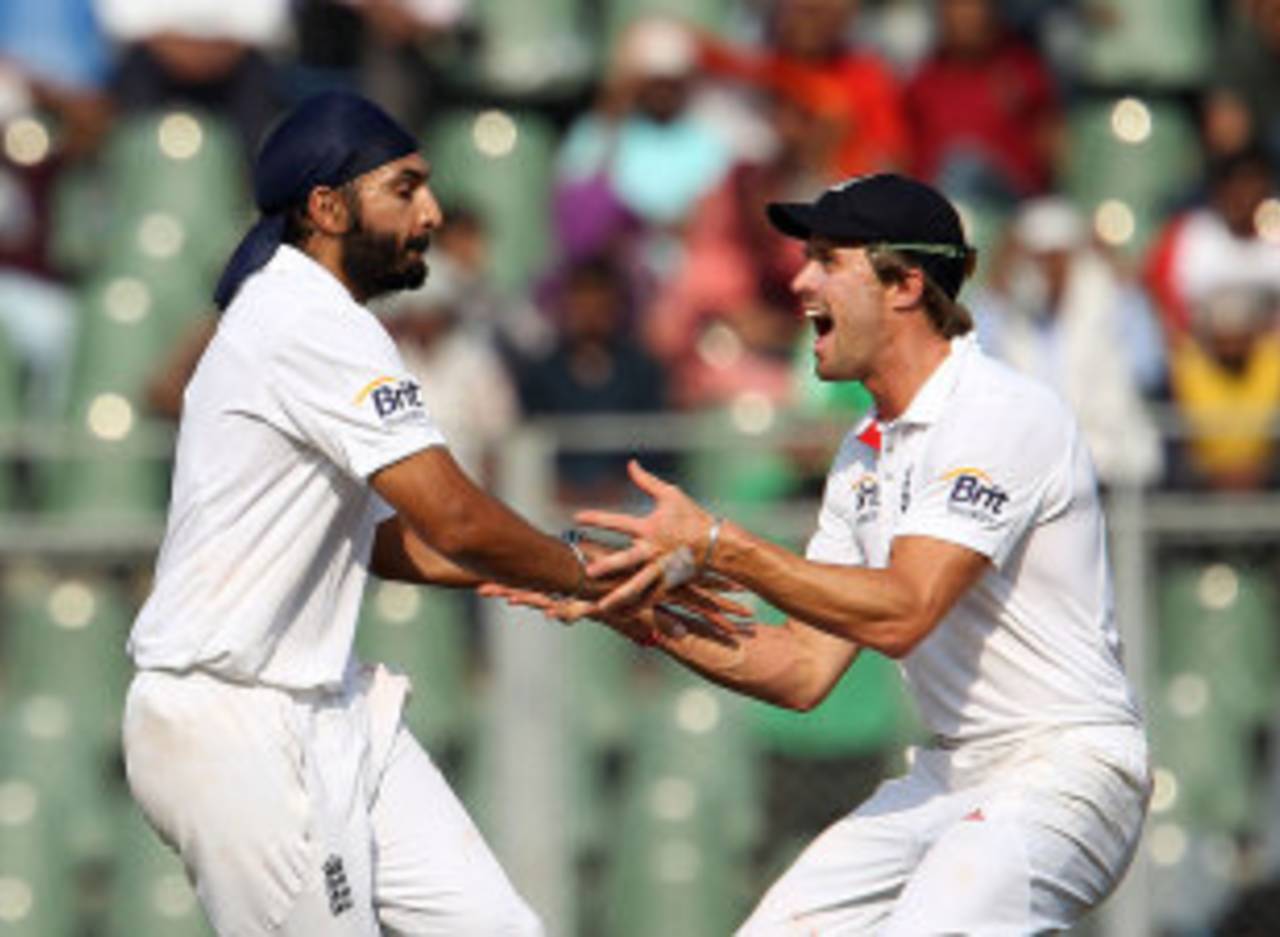
Only Alec Bedser and Jim Laker have taken more Test wickets at Old Trafford than Monty Panesar • BCCI
The last time England lost a Test at Old Trafford was in 2001, against Pakistan; since then, they've won six out of seven, and were only a wicket away from winning the one that got away. Australia haven't lost here since 1981, winning three out of five since then, but they were lucky to get away in 2005, when they were nine down for 371 chasing 423 for victory. Australia have no recent memory of Test defeat at this ground, but given the gulf between the two teams in this series, it'll require plenty of work from them to keep it that way after the next five days.
For England, Old Trafford is, results-wise, their best home venue over the last decade and more: among venues where they've played five or more Tests since 2001, their win-loss ratio of 6 at Old Trafford is the highest. They've been utterly dominant here during this period, averaging more than 40 with the bat and less than 28 with the ball. They've scored 13 hundreds and conceded only six to opposition batsmen, and their bowlers have a strike rate of 50 balls per wicket, compared to 74.2 for the opposition bowlers.
Australia will need to draw inspiration from Ricky Ponting's heroic 156 in the fourth innings in 2005, the fifth-highest score by an Australian batsman in the fourth innings of a Test. Despite that effort, Australia almost lost the match, which further illustrates the level at which England have been playing at this ground.
| Venue | Tests | Won/ Lost | W/L ratio | Bat ave | Bowl ave |
| Old Trafford | 8 | 6/ 1 | 6.00 | 40.39 | 27.85 |
| Lord's | 26 | 14/ 4 | 3.50 | 43.10 | 30.72 |
| Edgbaston | 11 | 6/ 2 | 3.00 | 38.15 | 32.31 |
| Trent Bridge | 12 | 8/ 3 | 2.67 | 32.42 | 27.27 |
| The Oval | 12 | 6/ 3 | 2.00 | 40.31 | 40.40 |
| Headingley | 10 | 5/ 4 | 1.25 | 36.11 | 35.15 |
In the days before the Test, much of the talk has been around the nature of the pitch, which is expected to offer more help to spinners. England have already suitably tweaked their squad to prepare for such an eventuality, bringing in Monty Panesar as the spinner to support Graeme Swann, while there's even been talk of Australia playing both Nathan Lyon and Ashton Agar.
The table below shows the performance of pace and spin here in the last eight Tests, and there's little to choose between the two. Fast bowlers have taken more wickets, but there's negligible difference in the averages. During this period, though, spinners have averaged better at two other England venues - Trent Bridge (81 wickets at 31.41) and Edgbaston (89 wickets at 31.59). England's spinners, though, have a better record here than the fast bowlers, averaging less than 25 runs per wicket.
| Wickets | Average | Strike rate | 5WI/ 10WM | |
| Pace | 186 | 32.13 | 56.9 | 7/ 1 |
| Spin | 73 | 33.75 | 68.1 | 6/ 1 |
The reason why the spin stats for England are so good here is because of Panesar: in three Tests at Old Trafford, Panesar has taken 25 wickets at 16.72, and a strike rate of 34 balls per wicket. In each of those three Tests, he has taken five-fors in the second innings - 5 for 72 against Pakistan in 2006, 6 for 137 against West Indies the following year, and 6 for 37 against New Zealand in 2008, which was also the last time he bowled in a Test at Old Trafford. Overall, Panesar's haul of 25 Test wickets is the third-highest by any bowler at this ground: only Alec Bedser (51 in seven Tests) and Jim Laker (27 in five, including the famous 10 for 53 and match haul of 19 for 90 in 1956).
James Anderson has only ten wickets from three Tests, though at a pretty good average, while Swann took six in the only Test he has played here, against Bangladesh in 2010.
| Bowler | Tests | Wickets | Average | Strike rate | 5WI/10WM |
| Monty Panesar | 3 | 25 | 16.72 | 34.1 | 3/ 1 |
| James Anderson | 3 | 10 | 27.10 | 3.92 | 0/ 0 |
| Graeme Swann | 1 | 6 | 18.33 | 29.3 | 1/ 0 |
| Stuart Broad | 1 | 0 | - | - | 0/ 0 |
Among the current England batsmen, Ian Bell leads the way with two hundreds and three fifties in eight Test innings, and an average of 81. Alastair Cook has enjoyed success here too, with centuries in each of his first two Tests at Old Trafford, but Kevin Pietersen has an aggregate of 268 in eight innings, with a highest of 68 despite going past 20 six times.
Among the current Australian lot, Michael Clarke is the only one to have played a Test here - he scored 7 and 39 in his two innings in 2005.
| Batsman | Tests | Runs | Average | 100s/ 50s |
| Ian Bell | 5 | 486 | 81.00 | 2/ 3 |
| Alastair Cook | 4 | 369 | 61.50 | 2/ 1 |
| Kevin Pietersen | 5 | 268 | 33.50 | 0/ 2 |
| Matt Prior | 2 | 133 | 44.33 | 0/ 1 |
The captain winning the toss here has chosen to bat in the last 14 Tests. The last time a team fielded first was England in the 1993 Ashes, and it didn't work out well for them: though they dismissed Australia for 289 in the first innings, they lost the Test by 179 runs. However, batting first hasn't always worked in the last 14 Tests either - the teams winning the toss have a 5-4 win-loss during this period.
For a venue which is regarded as one of the better ones for spin bowling in England, the fourth-innings scores at Old Trafford have been remarkably high - the average runs per wicket in the fourth innings in the last eight Tests is 44.47, the highest among all innings. In the last four fourth innings, England scored 231 for 3 to beat West Indies, Australia finished at 371 for 9 to draw in 2005, West Indies scored 394 when chasing a target of 455, and England scored 294 for 4 to beat New Zealand.
With the pitch likely to be drier this time, though, fouth-innings batting could be a lot more difficult in the third Ashes Test.
| 1st inngs | 2nd inngs | 3rd inngs | 4th inngs |
| 39.01 | 30.12 | 24.64 | 44.47 |
S Rajesh is stats editor of ESPNcricinfo. Follow him on Twitter