Top-order failures hurt visitors
England were not as dominant as they were expected to be, but were still far too strong for a West Indies team struggling for batting consistency
Madhusudhan Ramakrishnan
Jun 12, 2012, 1:26 PM
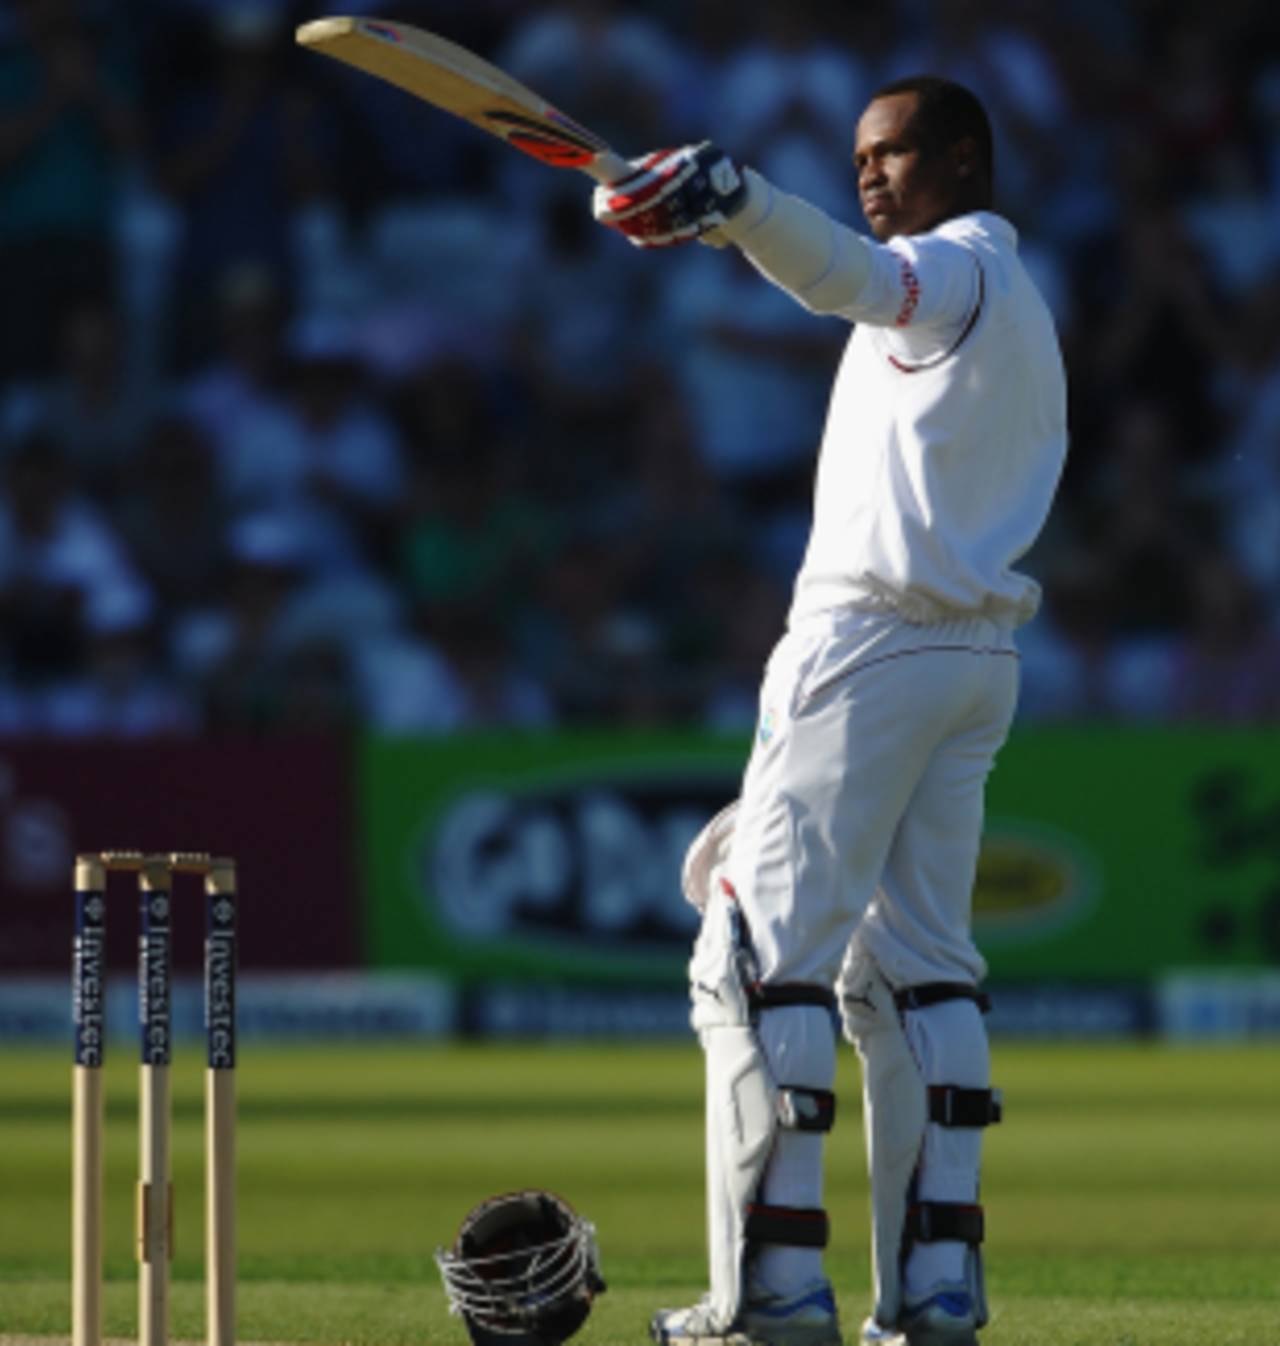
Marlon Samuels was remarkably consistent and ended the series as the highest run-getter • AFP
Ever since England came back to win the Lord's Test in the 2000 series against West Indies, they have completely dominated the head-to-head contests. Between the Lord's win and the final Test of this series, England had won 13 out of 15 home Tests against West Indies. Only persistent rain in Edgbaston and dogged resistance from West Indies' lower order prevented a whitewash.
West Indies briefly raised hopes of a surprise win at Lord's and managed to stay competitive but were simply overwhelmed by England's all-round strength. With Chris Gayle missing at the top of the order, the inexperienced opening batsmen were unable to fight it out in bowler-friendly conditions. England, not quite at their dominant best as they had been in recent home series, were still a far more potent bowling unit than West Indies, who struggled with injuries. On the batting front, England were far from impressive but were boosted by the timely return to form of Andrew Strauss, who scored consecutive centuries at Lord's and Trent Bridge.
West Indies were bowled out in each of the innings they batted (five innings) and averaged 30.98. In contrast, England averaged a much higher 43.58 while losing just 31 wickets. However, England's batting performance was well below their exploits in recent home series. Only twice since 2009 have England averaged lower (against Australia and Pakistan) in a home series. In contrast, England had averaged 61.12 in their previous home series against West Indies. Both West Indies and England had nine fifty-plus scores with West Indian batsmen scoring more centuries (three). England, however, were by far the better bowling team with Stuart Broad picking up the only five-wicket haul of the series.
| Team | Runs | Wickets lost | Runs per wicket | 100/50 | 5WI/10WM |
| England | 1351 | 31 | 43.58 | 2/7 | 1/1 |
| West Indies | 1549 | 50 | 30.98 | 3/6 | 0/0 |
The England-West Indies contests over the last decade in England have been a mismatch. With a below-par bowling attack and a vulnerable batting line-up, West Indies have hardly threatened. In the first Test at Lord's, disciplined batting in their second innings and an inspired burst by Kemar Roach created an opening but the lack of firepower in the attack meant that West Indies were unable to capitalise. An all too familiar collapse in the second innings at Trent Bridge ended West Indies' chances of levelling the series. On more than one occasion in their last two series (against India and Australia), West Indies had lost the grip after collapsing for sub-200 scores. Although the series result (2-0) was never in doubt given the gulf in quality, West Indies competed far better than they did on previous visits.
In 2000, when they lost 3-1 (first series loss in England for 31 years), West Indies had an excellent bowling average of 22.55 but a poor batting average of 21.67. Their average difference (difference between batting and bowling averages) in that series was -0.88. Following the retirements of Curtly Ambrose and Courtney Walsh, the bowling quality took a major hit in the subsequent series. In the next three series, the average difference values were -18.99, -20.47 and -38.77. In comparison, their corresponding figure in this series is a much improved -12.60. The wickets difference (difference between the wickets picked up per match and wickets lost per match) is the best for West Indies in the 2000 series (-1.60). In the 2012 series, the corresponding figure is much poorer (-6.33). In both 2004 and 2007, the wickets difference values were better than the number in the 2012 series. West Indies' worst performance on this front came in the 2009 series when they lost 40 wickets but managed to pick up just 24 (wickets difference of -12).
| Year | Matches | Wins/Losses | Bat avg | Bowl avg | Avg diff | Wickets/match (bat) | Wickets/match (bowl) | Wickets diff |
| 2000 | 5 | 1/3 | 21.67 | 22.55 | -0.88 | 17.40 | 15.80 | -1.60 |
| 2004 | 4 | 0/4 | 29.11 | 48.10 | -18.99 | 19.50 | 14.25 | -5.25 |
| 2007 | 4 | 0/3 | 28.60 | 49.07 | -20.47 | 17.00 | 13.25 | -3.75 |
| 2009 | 2 | 0/2 | 22.35 | 61.12 | -38.77 | 20.00 | 8.00 | -12.00 |
| 2012 | 3 | 0/2 | 30.98 | 43.58 | -12.60 | 16.66 | 10.33 | -6.33 |
With the openers badly out of form, the top-order (1-4) of West Indies wore a very unsettled look and managed an average of just 15.65. On the other hand, England's top order did much better averaging close to 50. Not only were Kevin Pietersen and Ian Bell in form, Strauss also got back among the runs and ended the series as England's top run-getter. West Indies were able to stay afloat in the first two Tests purely because of their battling middle order. After being recalled to the team, Marlon Samuels batted brilliantly and topped the run-scoring charts. He scored a century and three fifties in five innings and averaged 96.50. His series aggregate of 386 runs is the fourth-highest by a West Indian batsman in a series in England since 2000.
Shivnarine Chanderpaul came away without a century but still managed over 200 runs at an average of 78.33. West Indies' middle order (5-7) averaged 65 with two centuries and five fifties while England's middle order managed an average of 38.50 with three half-centuries. Denesh Ramdin and Tino Best were involved in a 143-run stand for the last wicket in the third Test with Best scoring a record 95. Darren Sammy's century at Trent Bridge and Best's heroics pushed up the lower order (8-11) average for West Indies to 21.50, which was higher than that of England (17.50).
| Batting position | Team | Runs | Average | SR | 100/50 |
| 1-4 | England | 838 | 49.29 | 55.24 | 2/4 |
| 5-7 | England | 308 | 38.50 | 56.93 | 0/3 |
| 8-11 | England | 105 | 17.50 | 48.83 | 0/0 |
| 1-4 | West Indies | 313 | 15.65 | 38.59 | 0/0 |
| 5-7 | West Indies | 780 | 65.00 | 47.07 | 2/5 |
| 8-11 | West Indies | 387 | 21.50 | 59.08 | 1/1 |
Since 2008, only New Zealand have a lower average than West Indies for the opening wicket. In the recent home series against Australia, the West Indies openers struggled and had five single-figure partnerships in six innings. They did better in England but an average of 22.40 meant that the middle order was almost always under pressure. England's openers managed only one fifty stand but were more consistent than their West Indian counterparts (average 38.60).
For both the second and third wickets, West Indies failed to aggregate 100 partnership runs. England, on the other hand, scored over 200 runs for both the partnership wickets and averaged 71.25 and 55.50 respectively. The in-form Samuels and Chanderpaul ensured that West Indies' middle order did not cave in meekly. West Indies averaged much higher than England for the fifth wicket and shared a century and two fifty stands. The visitors' seventh-wicket partnership was also more prolific with the highest stand coming in the second Test at Trent Bridge, where Sammy and Samuels added 204 in the first innings.
| Partnership wicket | England (Runs, Average) | England (100/50 stands) | West Indies (Runs, Avg) | West Indies (100/50 stands) |
| 1 | 193, 38.60 | 0/1 | 112, 22.40 | 0/0 |
| 2 | 285, 71.25 | 1/1 | 86, 17.20 | 0/0 |
| 3 | 222, 55.50 | 1/1 | 96, 19.20 | 0/1 |
| 4 | 220, 55.00 | 1/0 | 107, 21.40 | 0/0 |
| 5 | 195, 48.75 | 1/0 | 340, 68.00 | 1/2 |
| 6 | 66, 33.00 | 0/0 | 112, 22.40 | 0/1 |
| 7 | 30, 15.00 | 0/0 | 364, 72.80 | 1/0 |
Broad continued his superb run of form picking up 14 wickets in the series including 11 in the first Test at Lord's. In the first two Tests, Broad and James Anderson reaffirmed their status as one of the best opening-ball pairs. Broad troubled Adrian Barath dismissing him twice while conceding just 32 runs. Anderson, meanwhile, made life extremely difficult for Kieran Powell and Kirk Edwards dismissing them both twice while conceding only seven and ten runs respectively. Graeme Swann got Chanderpaul twice in four innings and improved his record against the left-hander to five dismissals in ten innings.
However, Swann had no such luck against Samuels. Samuels scored 131 runs 131 runs off 191 balls from Swann (run-rate of 4.11) without being dismissed even once. Roach bowled some quick spells and tasted success against Strauss (two dismissals at average of 27.00) and Jonny Bairstow (two dismissals at average of 12.00). Tim Bresnan's place in the squad was questioned before the start of the series but he ended the series as England's second-highest wicket-taker (12 wickets) with a best match haul of 8 for 141 at Trent Bridge.
| Bowler | Batsman | Runs | Dismissals | Average | Balls per dismissal |
| Stuart Broad | Adrian Barath | 32 | 2 | 16.00 | 25.50 |
| James Anderson | Kirk Edwards | 7 | 2 | 3.50 | 9.00 |
| James Anderson | Kieran Powell | 10 | 2 | 5.00 | 16.00 |
| Graeme Swann | Shivnarine Chanderpaul | 36 | 2 | 18.00 | 48.50 |
| Kemar Roach | Jonny Bairstow | 13 | 2 | 6.50 | 12.00 |
| Kemar Roach | Andrew Strauss | 54 | 2 | 27.00 | 65.00 |
| Graeme Swann | Marlon Samuels | 131 | 0 | - | - |
Madhusudhan Ramakrishnan is a sub-editor (stats) at ESPNcricinfo