Shikhar Dhawan enters, at the top
An analysis of performances after the second weekend of the World Cup
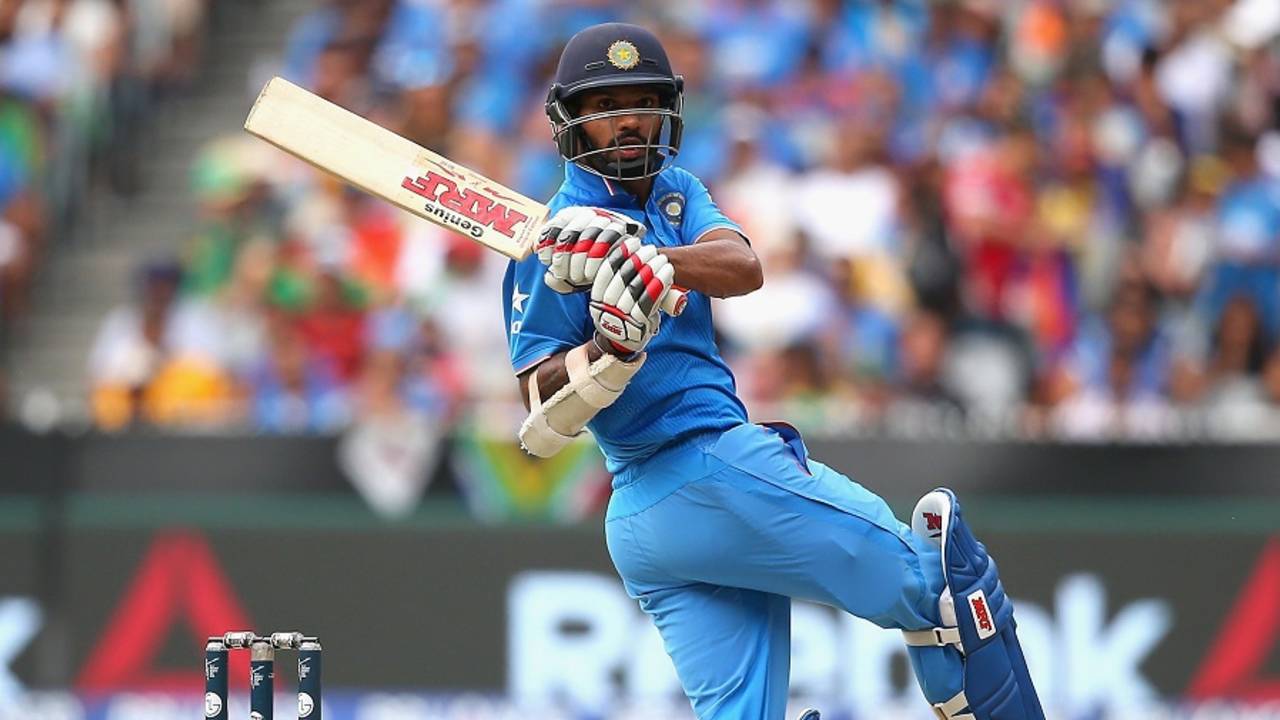
Shikhar Dhawan's century against one of the best bowling sides in the World has put him at the top of batting performances • Getty Images
This analysis will be done at suitable points during the World Cup 2015 so that the readers can see the way the Performance tables evolve. As more matches get played the top performance mosaic changes and readers can identify with what happened in the past few days. The qualifying bar for inclusion moves higher as more matches get played.
Sri Lanka almost slipped on the Afghan banana peel. They managed to avoid a disaster through a top class innings by a veteran and two supporting acts by younger players. And then India had an almost perfect day at the MCG, swamping South Africa. They batted with a lot of flair and conviction and then bowled and fielded outstandingly to tell the rest of the world that they are serious candidates for inclusion in the list containing the quartet of potential winners.
| SNo | Rating Pts | Year | ODI# | Batsman | For | Vs | Runs | Balls |
|---|---|---|---|---|---|---|---|---|
| 1 | 460 | 2015 | 3610 | S Dhawan | India | Saf | 137 | 146 |
| 2 | 397 | 2015 | 3601 | DA Miller | South Africa | Zim | 138* | 92 |
| 3 | 386 | 2015 | 3600 | JWA Taylor | England | Aus | 98* | 90 |
| 4 | 370 | 2015 | 3600 | AJ Finch | Australia | Eng | 135 | 128 |
| 5 | 363 | 2015 | 3607 | BB McCullum | New Zealand | Eng | 77 | 25 |
| 6 | 326 | 2015 | 3609 | DPMD Jayawardene | Sri Lanka | Afg | 100 | 120 |
| 7 | 314 | 2015 | 3601 | JP Duminy | South Africa | Zim | 115* | 100 |
| 8 | 290 | 2015 | 3602 | V Kohli | India | Pak | 107 | 126 |
| 9 | 268 | 2015 | 3603 | LMP Simmons | West Indies | Ire | 102 | 84 |
| 10 | 262 | 2015 | 3610 | AM Rahane | India | Saf | 79 | 60 |
Shikhar Dhawan's huge century moves to the top position in the batting table, with 460 rating points. It was a well-deserved placement. He paced the innings very well. The bowling attack's quality was a significant factor in this exalted position. Mahela Jayawardene's hundred has come in the sixth place. It would have been ranked higher if he had finished the job on hand. There is a fair bit of difference between scores of 125* and 100, while chasing 232.
It can be seen that the fifties are making way for the hundreds. Now the fifties have to be spectacular and special, such as those of James Taylor, Brendon McCullum and Ajinkya Rahane, to be in the top ten. Rahane's wonderful innings of 79 is in tenth position but is likely to drop off in the next table. It would, however, take a very special innings to move Dhawan off the top position.
| SNo | Rating Pts | Year | ODI# | Bowler | For | Vs | Analysis |
|---|---|---|---|---|---|---|---|
| 1 | 597 | 2015 | 3607 | TG Southee | New Zealand | Eng | 9.0 - 0 - 33 - 7 |
| 2 | 455 | 2015 | 3600 | MR Marsh | Australia | Eng | 9.0 - 0 - 33 - 5 |
| 3 | 429 | 2015 | 3602 | Sohail Khan | Pakistan | Ind | 10.0 - 0 - 55 - 5 |
| 4 | 321 | 2015 | 3608 | JE Taylor | West Indies | Pak | 7.0 - 1 - 15 - 3 |
| 5 | 311 | 2015 | 3600 | ST Finn | England | Aus | 10.0 - 0 - 71 - 5 |
| 6 | 286 | 2015 | 3602 | Mohammed Shami | India | Pak | 9.0 - 1 - 35 - 4 |
| 7 | 221 | 2015 | 3605 | Mashrafe Mortaza | Bangladesh | Afg | 9.0 - 2 - 20 - 3 |
| 8 | 211 | 2015 | 3603 | GH Dockrell | Ireland | Win | 10.0 - 0 - 50 - 3 |
| 9 | 201 | 2015 | 3604 | JH Davey | Scotland | Nzl | 7.0 - 0 - 40 - 3 |
There is almost no change to the bowling table. In the two matches played today, there was no exciting bowling performance. No one captured more than 3 wickets. Hamid Hassan did well but the team did not win. Another wicket or two was needed, both for the upset win and inclusion in the table here.
| SNo | Rating Pts | Year | ODI# | Player | For | Vs | Runs | Balls | Analysis |
|---|---|---|---|---|---|---|---|---|---|
| 1 | 506 | 2015 | 3600 | MR Marsh | Australia | Eng | 23 | 20 | 9.0-0-33-5 |
| 2 | 353 | 2015 | 3608 | AD Russell | West Indies | Pak | 42* | 13 | 8.0-2-33-3 |
| 3 | 297 | 2015 | 3606 | SC Williams | Zimbabwe | Uae | 76* | 65 | 8.0-0-43-2 |
| 4 | 281 | 2015 | 3599 | CJ Anderson | New Zealand | Slk | 75 | 46 | 3.1-0-18-2 |
| 5 | 249 | 2015 | 3609 | AD Mathews | Sri Lanka | Afg | 44 | 81 | 7.0-0-41-3 |
| 6 | 248 | 2015 | 3605 | Shakib Al Hasan | Bangladesh | Afg | 63 | 51 | 8.5-0-43-2 |
Angelo Mathews had an excellent day against Afghanistan, capturing three wickets and scoring a valuable 40. He comes in only in the fifth position since, like Jayawardene, he did not complete the job on hand.
| SNo | Rating Pts | Year | ODI# | Team | Own score | Vs | Other score |
|---|---|---|---|---|---|---|---|
| 1 | 713 | 2015 | 3607 | New Zealand | 125 for 2 in 12.2 | Eng | 123 for 10 in 33.2 |
| 2 | 691 | 2015 | 3610 | India | 307 for 7 in 50.0 | Saf | 177 for 10 in 40.2 |
| 3 | 664 | 2015 | 3608 | West Indies | 310 for 6 in 50.0 | Pak | 160 for 10 in 39.0 |
| 4 | 640 | 2015 | 3605 | Bangladesh | 267 for 10 in 50.0 | Afg | 162 for 10 in 42.5 |
| 5 | 596 | 2015 | 3599 | New Zealand | 331 for 6 in 50.0 | Slk | 233 for 10 in 46.1 |
| 6 | 595 | 2015 | 3600 | Australia | 342 for 9 in 50.0 | Eng | 231 for 10 in 41.5 |
| 7 | 592 | 2015 | 3602 | India | 300 for 7 in 50.0 | Pak | 224 for 10 in 47.0 |
| 8 | 590 | 2015 | 3603 | Ireland | 307 for 6 in 45.5 | Win | 304 for 7 in 50.0 |
| 9 | 587 | 2015 | 3604 | New Zealand | 146 for 7 in 24.5 | Sco | 142 for 10 in 36.2 |
| 10 | 583 | 2015 | 3609 | Sri Lanka | 236 for 6 in 48.2 | Afg | 232 for 10 in 49.4 |
New Zealand retains its top position. Closely following in second place is India's dismantling of South Africa's cloak of invincibility. The quality of South African bowling, the margin of win and the ticking of all boxes moved India to the second position. Sri Lanka's tough win is in tenth position but this could be a short stay for this match in this table.
A brief introduction into the methodology of Performance Analysis.
The Batting Performance Ratings analysis takes into account the Runs scored, Balls faced, Next highest score (if this is the highest score), % of Team score, Innings status at entry, Bowling quality, Pitch information, Team strengths, Target score in front, Match location, Result and Match importance. These parameters are given appropriate weights. The calculations are done in such a way that Rating points of 1000 would be allotted to a mind-blowing and match-winning score of 200 in 150 balls in a WC final.
The Bowling Performance Ratings analysis takes into account the Wickets captured, Quality of batsmen dismissed, Scores at which batsmen were dismissed, Bowling accuracy, Batting quality, Pitch information, Team strengths, Target being defended, Match location, Result and Match importance. The calculations are done in such a way that Rating points of 1000 would be allotted to a magnificent and match-winning analysis of 10-2-15-6 in a WC final.
The Player Performance Ratings analysis takes into account the Batting Rating points, Bowling Rating points and the Fielding Rating points, which is a combination of catches and stumpings. There are minimum criteria for batting and bowling stints to ensure that these are genuinely all-round performances.
The Team Performance Ratings analysis takes into account the Result, Margin of win, Resources utilized, Team strengths, Match location and Match importance. The calculations are done in such a way that Rating points of 1000 would be allotted to an overwhelming win by 150 runs or 8 wickets in a WC final.
Anantha Narayanan has written for ESPNcricinfo and CastrolCricket and worked with a number of companies on their cricket performance ratings-related systems