The IPL's most productive over, and the Gayle effect
An over-wise analysis of runs scored and wickets lost in the tournament, and the difference Chris Gayle has made to Bangalore's batting
S Rajesh
13-May-2011
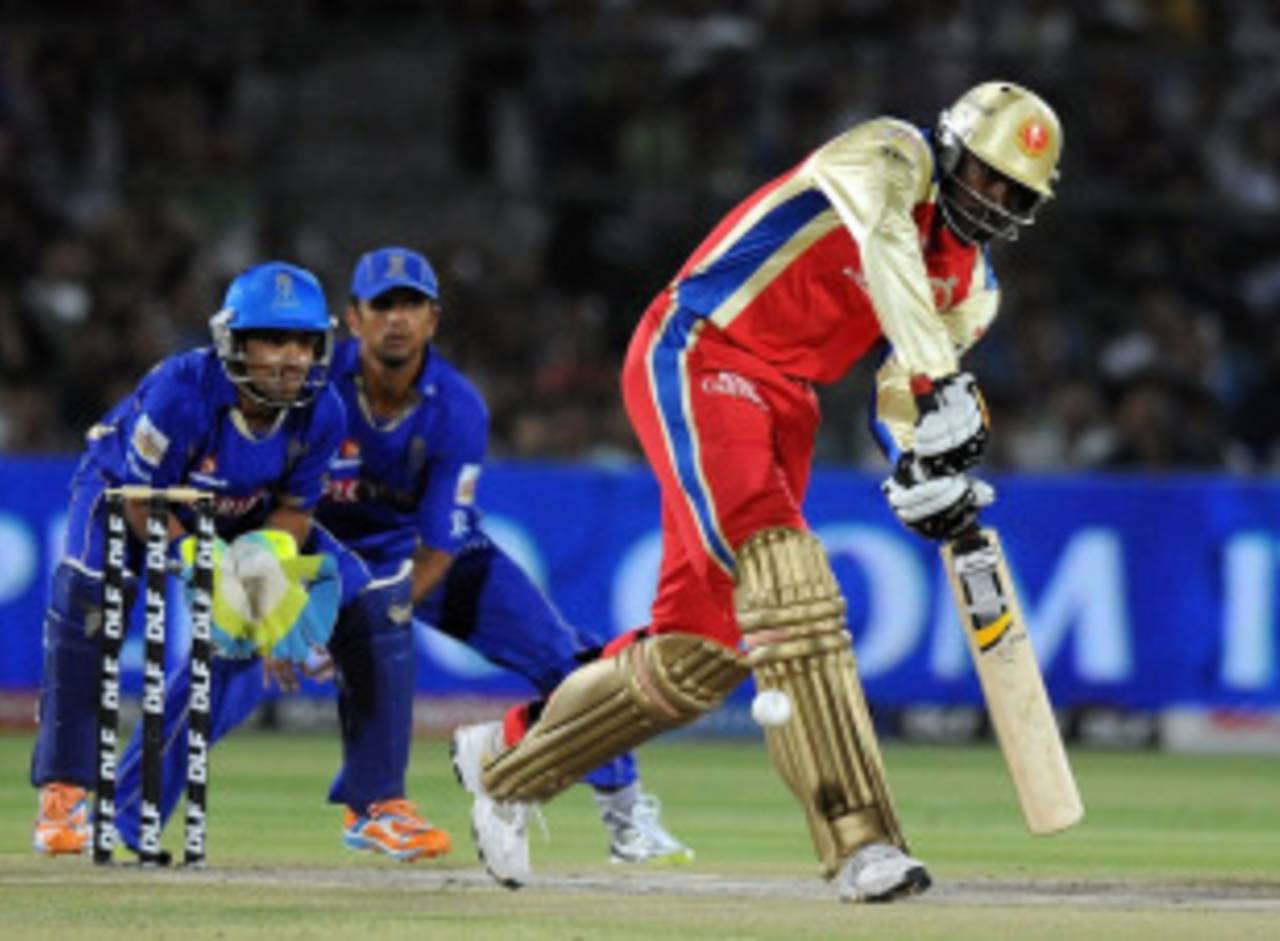
Despite Chris Gayle's frenetic starts, the overall run rate in the Powerplay overs has been much lower than in IPL 2010 • AFP
Fifty-five matches into IPL 2011, a few trends have clearly emerged. One, teams have been quite circumspect at the start of their innings, choosing to begin cautiously and keep wickets in hand; this, despite the fielding restrictions that are in place in the first six overs. Two, in the middle overs (6.1 to 14.0), teams have actually scored at a faster rate than in the first six, even if the difference is marginal. Three, teams have usually pressed the accelerator from the 15th over, provided they've had wickets in hand: the average run rate in each over from the 15th is more than 8.30, while many more wickets also tend to fall as teams scamper for quick runs - 44% of the total wickets in this IPL, and 45% of the total number of sixes, have come in the last six overs.
These, and many more interesting trends, are revealed in an over-by-over analysis of this year's IPL. Overall, the bowlers have done pretty well to restrict the scoring rate to 7.67 runs per over, which translates into a 20-over total of 153.4 - about 5.5% lower than the average score in IPL 2010 of 162.4.
The biggest change has been in the first six overs: in 2010, the average run rate in the Powerplay overs was 7.89 runs per over; this time it has dropped to 7.13, which means the average six-over score in this tournament has been 43. The over-wise table also shows that the average run rates for the first two overs are less than seven.
A few other observations:
- The seventh over is the only one in which the average scoring rate drops below six - to 5.99. Clearly teams prefer to have an over to cool off after the last Powerplay over. The seventh over is also the one with the fewest boundaries - only 47 fours and nine sixes. The most fours have been struck in the third over (111), and the most sixes in the 16th (39).
- The average run rate is only 6.06 in the first and 6.62 in the second over, but in the third it spurts to 8.06. In fact, the third over is the only one apart from the last six when the rate has topped eight.
- The highest run rate, quite expectedly, is in the last two overs (9.50), but the most runs have been scored in the 16th over (891). That's obviously because some innings have ended before the 19th and 20th overs.
- Going by these numbers, teams have, on an average, roughly doubled their 11-over score - 77 runs have been scored in the first 11 overs on average, and 78 in the last nine.
- One-hundred-and-sixteen wickets have fallen in the last two overs, which is 19% of the total wickets in the IPL.
The over-wise numbers for the first innings are slightly different, though, which is because teams approach the second innings differently, depending on the target in front of them. The scoring rates in the Powerplay and middle overs are slightly lower for the team batting first, but it spurts to 9.19 in the last six overs. The 14th over seems to be an excellent one for teams batting first - they average almost 50 per wicket at a scoring rate of more than eight. Thereafter the average drops, though the run rate climbs up towards nine.
| Over No. | Runs | Wickets | Average | Run-rate | 4s/ 6s | 1st inng-average | Run rate |
| 1 | 655 | 18 | 36.38 | 6.06 | 81/ 9 | 41.37 | 6.12 |
| 2 | 716 | 26 | 27.53 | 6.62 | 101/ 6 | 43.12 | 6.38 |
| 3 | 871 | 21 | 41.47 | 8.06 | 111/ 23 | 33.33 | 7.40 |
| 4 | 789 | 28 | 28.17 | 7.30 | 100/ 12 | 26.14 | 6.77 |
| 5 | 769 | 33 | 23.30 | 7.12 | 100/ 16 | 23.88 | 7.51 |
| 6 | 825 | 27 | 30.55 | 7.65 | 109/ 15 | 37.25 | 8.30 |
| Powerplay overs | 4625 | 153 | 30.22 | 7.13 | 602/ 81 | 32.32 | 7.08 |
| 7 | 647 | 20 | 32.35 | 5.99 | 47/ 9 | 28.36 | 5.77 |
| 8 | 809 | 21 | 38.52 | 7.49 | 76/ 16 | 34.63 | 7.05 |
| 9 | 793 | 23 | 34.47 | 7.34 | 63/ 18 | 24.33 | 6.75 |
| 10 | 755 | 23 | 32.82 | 6.99 | 58/ 20 | 29.53 | 7.11 |
| 11 | 782 | 30 | 26.06 | 7.30 | 60/ 20 | 34.58 | 7.68 |
| 12 | 829 | 19 | 43.63 | 7.74 | 73/ 21 | 33.41 | 7.42 |
| 13 | 803 | 29 | 27.68 | 7.51 | 50/ 29 | 47.00 | 6.96 |
| 14 | 807 | 24 | 33.62 | 7.74 | 58/ 26 | 49.66 | 8.27 |
| Middle overs | 6225 | 189 | 32.93 | 7.26 | 485/ 159 | 33.85 | 7.13 |
| 15 | 869 | 35 | 24.82 | 8.50 | 74/ 35 | 19.08 | 8.48 |
| 16 | 891 | 32 | 27.84 | 8.96 | 64/ 39 | 27.88 | 9.41 |
| 17 | 819 | 39 | 21.00 | 8.32 | 62/ 27 | 22.45 | 8.47 |
| 18 | 837 | 45 | 18.60 | 9.08 | 68/ 34 | 16.37 | 9.31 |
| 19 | 808 | 55 | 14.69 | 9.50 | 59/ 36 | 16.75 | 9.72 |
| 20 | 697 | 61 | 11.42 | 9.50 | 49/ 27 | 12.00 | 9.84 |
| Last six overs | 4921 | 267 | 18.43 | 8.94 | 376/ 198 | 17.77 | 9.19 |
| Overall | 15,771 | 609 | 25.89 | 7.67 | 1463/ 438 | 25.50 | 7.71 |
A comparison with last year's IPL shows that the run rates are lower this year at all three stages of the 20-over innings. However, in 2010, batting sides did much better in the Powerplay overs, and the scoring dropped in the eight-over period in the middle, before picking up again in the last six. This year the first six have produced fewer runs than the middle eight. Also, the scoring rates in the most productive overs exceeded 10 last year - it was 10.04 in the 19th and 10.91 in the 20th; this time, no over has gone beyond 9.50. And last year, the lowest-scoring over was the first, with a run rate of 6.38; no other over had a rate of less than seven.
| Over range | 2011 - average | Run rate | 2010 - average | Run-rate |
| Powerplay overs | 30.22 | 7.13 | 32.28 | 7.89 |
| Middle overs (6.1 to 14.0) | 32.93 | 7.26 | 28.41 | 7.54 |
| Last six overs | 18.43 | 8.94 | 20.56 | 9.24 |
| Total | 25.89 | 7.67 | 26.20 | 8.12 |
The Gayle effect
Bangalore's IPL campaign has been one of two parts - before Gayle, and after him. Before Gayle arrived to help Bangalore out, they had won one match out of four, losing to Mumbai, Deccan and Chennai. The batting had struggled for momentum, managing a strike rate of only 117.6 runs per 100 balls, and an average of 23.37 runs per wicket. In terms of strike rate they were seventh on the table, with only Kolkata, Rajasthan and Mumbai doing worse. (Mumbai could afford to, since they were often chasing low targets.)
| Matches | Runs | Average | Run-rate | 4s/ 6s | |
| Before Gayle | 4 | 561 | 23.37 | 7.05 | 49/ 18 |
| Since Gayle arrived | 6 | 961 | 45.76 | 8.88 | 103/ 45 |
Since Gayle's arrival, though, Bangalore have swept to the top of the run rates table, and the difference between their numbers and those of the second-best team is significant. The overall numbers show that Bangalore's batting average is more than double that of the next-best; their run rate is more than one run better than Delhi's.
In the first six overs the difference is even more substantial, with Bangalore achieving stunning numbers. Before Gayle arrived they averaged 4.88 runs per over, and 11.80 runs per wicket (runs off the bat only) - both were easily the worst among all teams. In four games during that period, Bangalore lost 10 wickets in the first six overs; in six games since Gayle's arrival, they've scored 353 runs for the loss of three wickets, at an average of more than 100 and a run rate of almost 10 runs per over. The way he's going, it's quite likely that Gayle will end up with the orange cap at the end of the tournament. He'll have deserved it completely, for no batsman has entertained more than Chris Gayle in IPL 2011.
| Team | Overall average | Run-rate | 4s/ 6s | Powerplay average | Run-rate | 4s/ 6s |
| Royal Challengers Bangalore | 48.05 | 8.88 | 104/ 45 | 117.66 | 9.76 | 49/ 16 |
| Delhi Daredevils | 23.68 | 7.61 | 107/ 39 | 19.30 | 5.92 | 33/ 5 |
| Chennai Super Kings | 33.93 | 7.33 | 84/ 29 | 34.42 | 5.71 | 27/ 2 |
| Mumbai Indians | 23.34 | 7.19 | 97/ 31 | 24.90 | 6.52 | 44/ 4 |
| Kolkata Knight Riders | 29.15 | 7.02 | 75/ 17 | 33.71 | 6.55 | 35/ 2 |
| Deccan Chargers | 21.30 | 6.87 | 79/ 14 | 35.28 | 6.79 | 30/ 6 |
| Kings XI Punjab | 18.29 | 6.68 | 82/ 19 | 20.50 | 5.64 | 29/ 4 |
| Pune Warriors | 22.52 | 6.62 | 82/ 30 | 22.58 | 6.42 | 42/ 2 |
| Rajasthan Royals | 24.60 | 6.58 | 69/ 15 | 53.00 | 5.83 | 28/ 2 |
| Kochi Tuskers Kerala | 15.48 | 5.97 | 68/ 10 | 15.50 | 5.97 | 33/ 2 |
All stats updated till the 55th match of IPL 2011.
S Rajesh is stats editor of Cricinfo