How often has one bowler dominated the bowling figures in a Test?
Or were wickets always shared around? Examining wicket-distribution patterns of the five most dominant teams in Test history
Anantha Narayanan
26-Nov-2023
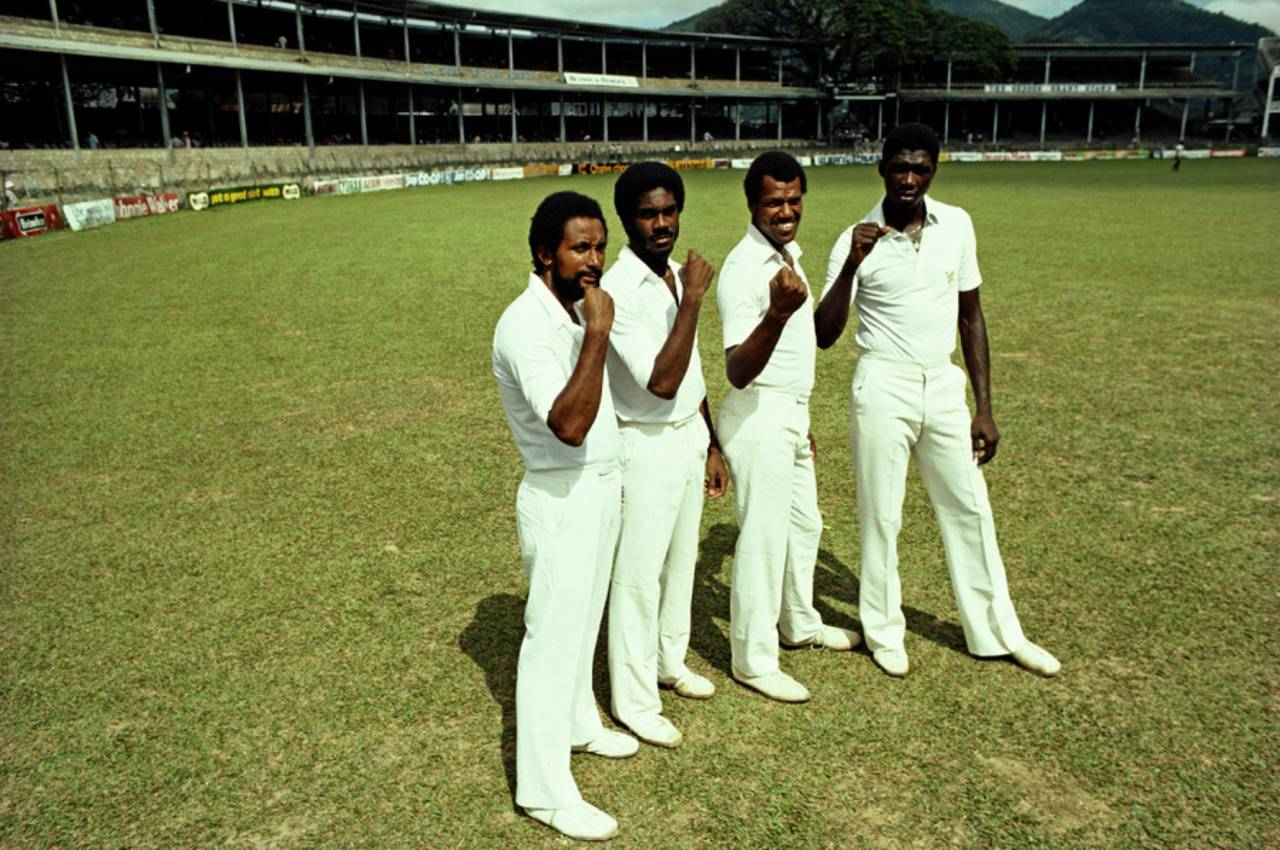
The WDI values suggest that in the heydays of West Indies fast bowling, bowlers took wickets more equitably without any one of them dominating the bowling figures • Adrian Murrell/Getty Images
The acorn for this oak tree was planted when S Rajesh, ESPNcricinfo's stats editor, sent an observation on the greatest bowling performances article published in August. He mentioned that the West Indian bowlers of the 1980s-1990s were not present in significant numbers. He also suggested that it was most likely because there were always three to four strong bowlers and the wickets might have been distributed among them. In this article, I have decided to provide substance to this seemingly off-the-cuff, but well-thought-out explanation. I also decided that I will not analyse the entire set of Test matches, but limit myself to the five best-performing teams in history. They have also played sufficient matches in their eras.
First, let us see which are these five teams. There is probably no need to give any justification for these selections.
- Australia: January 1946 - February 1953
- West Indies: June 1976 - May 1984
- West Indies: June 1984 - May 1991
- Australia: November 1994 - July 2003
- Australia: October 2005 - January 2013
The only explanation needed here is for West Indies. Their period of domination was really one of 17 contiguous years from 1975 to 1991. However I have chosen to split it into two periods depending on the bowlers' induction patterns. The five eras are reasonably distributed and populated.
Now, let us get into the nuts and bolts. First, at the top, I decided that only innings where the bowlers captured nine or ten wickets will be considered for this analysis. Anything less will give us wicket patterns that are difficult to handle. I also wanted three bowlers to capture wickets so that there is structural soundness.
I created a new value called the Wickets Dispersal Index. This runs from 0.0 to 10.0 (or more), in which 0.0 indicates perfect distribution and 10.0 (or more) represents the wildest of distributions. Anything in between represents middle-level values. Especially the 4-6 group, which represents a mid-level balanced distribution.

First, a look at the innings where bowlers took nine wickets. The most perfect bowler wicket distribution is here. Consider 3-3-3, the perfect symmetrical distribution. It is to be allotted a WDI of 0.0. This is done by subtracting each value by three, taking the absolute value, and then adding them. 2-3-4 will generate a WDI of 2.0. And 6-2-1 will generate a WDI of 6.0. Readers can check these values.
Now, the ten-wicket situations. The most perfect bowler wicket distribution is 4-3-3. As a special consideration, this is allotted a WDI of 0.0. All other cases are handled by subtracting each wicket-capture value by three, taking the absolute value and adding them. A combination of 2-3-5 will generate a WDI of 3.0. And 6-2-2 will generate a WDI of 5.0. It is essential for readers to understand the concept of WDI clearly. To illustrate that further, I have given below the typical WDI values.
In this chart, I have presented examples of the wicket distributions, one representative for each WDI value, both for nine and ten wickets. It is interesting to note that the WDI of 1.0 can never be reached. The reason is simple: take a distribution of 4-3-2 (closest to 3-3-3). The difference of one (for four wickets) has to be compensated by an equal value of one (for two wickets). So, the WDI value has to be a minimum of 2.0. To understand the WDI concept, please go through all the presented distributions carefully.
The Don Bradman- and Lindsay Hassett-led Australian team had a WDI distribution strongly centred around the middle values. There is no WDI value of 0.0, indicating that there was no instance of 3-3-3 or 4-3-3 distributions. There were two instances of 10-plus WDI values. One was in Adelaide when Ray Lindwall took 7 for 38 against India, while the other was the only instance of a WDI value of 11 in this lot of matches. In the Brisbane Test against South Africa, the distribution was an amazing 6-1-1-1-1. Otherwise, the 4-6 grouping has over 50% of the population, indicating an overall balanced distribution.
The first of the West Indies teams went the other way. There were no fewer than four WDI values of 0. In 1977 in Kingston, Colin Croft, Joel Garner, and David Holford captured three wickets each. Towards the end of 1979, there was a lovely combo of Holding-Croft-Garner gathering 4-3-3 wickets in Melbourne. The MCG crowd must have had a wonderful day, maybe wondering why Andy Roberts was not taking no wickets. In 1980 in Manchester, Roberts, Garner, and Malcolm Marshall picked up three wickets each, with Michael Holding going wicketless. Finally in Kanpur in 1983, Marshall, Holding and Winston Davis picked up four, three, and three wickets respectively.
Thus, out of 97 innings, there were four instances when West Indies secured a WDI value of 0.0. That indicates a unique distribution pattern where wickets were shared equitably. This is further proved by the fact that the middle balanced group has over 60% population. And by the fact that there is not a single instance of WDI value of 10. That wild value was never reached.
The second West Indian team follows the first with minor variations. In Bridgetown against England in 1986, Garner, Patrick Patterson, and Holding captured 4-3-3 wickets, leaving Marshall wicketless. In the only other instance, in Brisbane in 1988, Marshall, Curtly Ambrose, and Courtney Walsh captured four, three, and three wickets respectively. This team also did not reach the high WDI value of 10.0, indicating that the bowling was rarely dominated by one bowler.
We now come to Australia either side of the millennium. To start with, this Australian team had seven innings with WDI values of 0, which was 4.5% of the total innings. The occurrences were in Perth, 1995 (Craig McDermott, Glenn McGrath, Shane Warne), Manchester 1997, Harare 1999, Adelaide 1998, Perth 1999, Sydney 2002, and Sharjah 2002.
The common feature is that McGrath was the only bowler who appeared in all seven Tests. With a middle grouping of over 50%, the era showed a strong balanced bowling phase. At the other end we had a 7-1-1-1 sweep at the SCG in 1999. Stuart MacGill swept everything before him and left the crumbs to the illustrious trio of McGrath, Colin Miller and Warne. In Colombo in 2002, it was again 7-1-1-1. This time it was Warne who swept the board and saved the leftovers for McGrath, Jason Gillespie and Brett Lee.
Now we come to the the Australian era of the 21st century. In Hobart in 2005, McGrath-Lee-MacGill captured 4-3-3 wickets. At the Wanderers in 2006, it was Stuart Clark-Lee-Warne who captured 4-3-3 wickets. Then the new bowlers' regime started. In Hamilton in 2010, it was Mitchell Johnson, Ryan Harris and Doug Bollinger who did the balancing act. Finally, at the SCG in 2012, the trio of James Pattinson, Ben Hilfenhaus and Peter Siddle shared the wickets. Maybe it is no surprise that there is the absence of the 10.0 WDIs. No single bowler dominated the scene. It is a feature of this era that the middle group had over 60% representation.
The zero WDI value was conspicuously absent during the first Australian team era. Then it picked up and had a decent population later, culminating in a relatively high value of 7 during the second Australian era, spanning the millennium. This indicates the presence of three quality bowlers almost always.
When we come to the 10-plus WDI values, the occurrences are few and far between. Just two occurrences each in the two Australian eras. With strong bowlers competing for the spoils, it was not that easy to capture seven-plus wickets.
Conclusion
The whole scenario is so topsy-turvy that I don't think I will be able to offer a clear solution to the question asked in the beginning by Rajesh. The readers can draw their own interpretation. In the meantime, I am going to highlight some of the outliers. This process itself might throw some insights. I am going to refer to the eras in an abbreviated form, such as Australia-2.
1. The seven WDI 0 values in the Australia-2 era is truly amazing. As many as seven, representing 4.5% of the total, had the tight wicket distributions of 3-3-3 and 4-3-3, indicating the presence of top quality bowlers.
2. The four WDI 0 values in the West Indies-1 era, representing a huge 4.6%. This could be probably be expected, considering that there were four top-quality fast bowlers always floating around.
3. The presence of two 10/11 WDI values, indicating the single-bowler-dominant innings in the Australia-1 era, is a surprise, indeed. It should be noted that the mere presence of a seven-wicket haul does not lead to a high WDI value. For instance, 7-3 leads a middle-level of WDI of 4 while a distribution of 7-1-1-1 has a high WDI of 10.0. There are two WDI value of 10.0 in Australia-2 also. But that was out of 157 innings while Australia-1 had only 58.
4. The high 60%-plus population in the middle group of 4-6 in West Indies-1, West Indies-2 and Australia-2 represents a significant level of the balanced distribution. Amongst these, the 67.4%, representing more than two-thirds of the West Indies-2 innings, is amazing. Maybe this single factor covering the two West Indies eras symbolises the presence of strong West Indian fast-bowler quartets. Maybe this provides the answer to Rajesh's query also.
Summary and other Tests comparisons
In the final distribution summary of the five leading teams, a WDI of 4 has a population of 114 (22.2%) and 5, a value 0f 110 (21.4%).
There were 3459 innings other than the Tests belonging to these five eras. There were 88 innings with WDI 0 values. This represents 2.5%. There were 59 innings with WDI values 10 or more, including three with WDI values of 12. At the MCG in 1898, England had an unbelievable wicket distribution of 3-1-1-1-1-1-1. In Brisbane in 1963, Australia had a distribution of 5-1-1-1-1-1. A few years later at the Wanderers, Australia's distribution was 2-2-1-1-1-1-1.
There were 1968 instance of the classification 4-6, representing 56.9%. In the final distribution summary of these 3459 innings, a WDI of 4 has a population of 660 (19.1%) and 5, a value of 735 (21.2%).
Results summary
Finally, as a closing data point, let me leave the readers with the summary of results of the five teams.
New section
From my last article onwards, I am presenting a new nugget. In each piece, I will highlight a numerical outlier relating to Test and ODI cricket. I started with the intriguing question: "Which bowling analysis occurs most in Test cricket?" This time I am switching the same question to ODI cricket. If anyone can guess the answer, provided below, they are indeed a great reader of the game.
The most common ODI analysis is, surprisingly, 0 for 24. That had 508 occurrences. This is followed by 0 for 23, with 500 occurrences, and 0 for 18 with 476 instances. What do 23 or 24 signify? Six overs at an average economy rate of 4.0. Maybe six overs is the key number. Among the bowling figures with at least one wicket, it is 1 for 38, with 455 instances. The highest for more than one wicket are 2 for 38 (317), 3 for 36 (147), 4 for 33 (58), and 5 for 33 (21). Why these have turned out this way is for readers to spend time over. One thing can be noticed: the runs conceded seem to be close to each other, that too around the all-time runs-per-wicket value, where a minimum of one wicket has been captured.
Talking Cricket Group
Any reader who wishes to join my general-purpose cricket-ideas-exchange group of this name can email me a request for inclusion, providing their name, place of residence, and what they do.
Any reader who wishes to join my general-purpose cricket-ideas-exchange group of this name can email me a request for inclusion, providing their name, place of residence, and what they do.
Email me your comments and I will respond. This email id is to be used only for sending in comments. Please note that readers whose emails are derogatory to the author or any player will be permanently blocked from sending in any feedback in future.
Anantha Narayanan has written for ESPNcricinfo and CastrolCricket and worked with a number of companies on their cricket performance ratings-related systems