The brilliance of the three Ws
How three batsmen from Barbados lifted West Indies' middle order to an unprecedented high
S Rajesh
26-Sep-2011
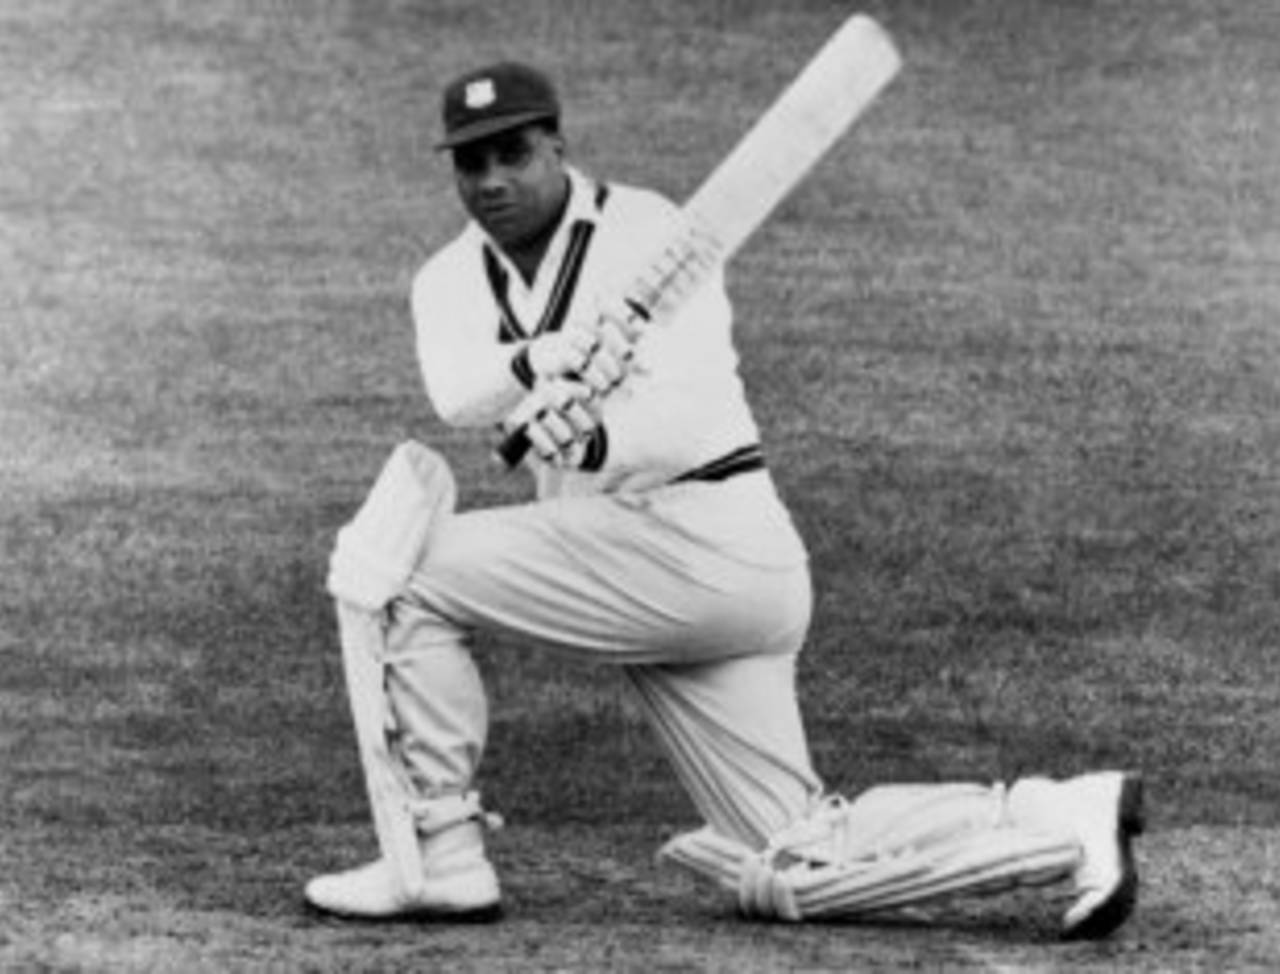
Clyde Walcott was one-third of a trio of outstanding West Indian middle-order batsmen in the late 1940s and 1950s • Getty Images
Before the Second World War, West Indies were a decidedly lightweight Test side. They began their Test journey in 1928, and over the next 11 years played 22 times, but with limited success - four wins were offset by 12 defeats, eight of them by an innings, and another by 10 wickets. They notched up their first innings win in 1935, against England in Kingston, but played only three more times before the war intervened and ensured there was no further cricket for them for the next eight years. At this point in their fledgling Test career, West Indies had produced only one truly great batsman: George Headley, who would remain a great in any age and era of West Indies cricket. His 19 Tests had fetched him 2135 run at 66.71, with 10 centuries, which was twice as many as all the other West Indians put together had managed.
Test cricket resumed for West Indies after the war in January 1948, and their side for that first game - on January 21, versus England in Barbados - included Clyde Walcott, who opened the batting and also kept wicket, and Everton Weekes, who batted No. 3. Both belonged to Barbados, and were hence starting out on home territory, and in the next Test they were joined by another Barbadian, Frank Worrell. In the first innings of that game, they occupied positions 3-5, slots they would take several times over the next decade, going on to become one of the greatest middle-order line-ups the game has ever seen.
One of the most remarkable aspects of their success was the fact that it came at a time when West Indies cricket was still trying to find its feet, with only one truly great international performer. Headley played only three Tests after the war, and despite his outstanding career, West Indies' overall middle-order stats had been pretty ordinary before the three Ws came along: till January 20, 1948, the average for the middle order (Nos. 3-6) in their 22 Tests had been 29.38, well below the corresponding numbers for Australia (35.42) and England (35.57).
Over the next decade (1948 to 1958), the stats for Australia and England improved marginally, but for West Indies the average went up by a whopping 63% compared to their middle-order average before the three Ws came along. That put them on a different level altogether when compared to the other teams: the West Indies middle order averaged 47.99, while the next-best was Australia at 39.15. The difference between the two teams, in percentage terms, was almost 23, which is remarkable considering some of the other names who were around during that period. Australia had Neil Harvey and Lindsay Hassett; Denis Compton, Peter May and Tom Graveney were all around for England; while Vijay Hazare and Polly Umrigar scored a fair number of runs for India. Yet collectively they paled before the combined brilliance of Weekes, Walcott and Worrell.
| Team | Tests | Runs | Average | 100s/ 50s |
| West Indies | 49 | 14,542 | 47.99 | 43/ 65 |
| Australia | 56 | 13,273 | 39.15 | 37/ 54 |
| India | 39 | 8322 | 36.50 | 22/ 39 |
| England | 84 | 18,489 | 36.32 | 37/ 93 |
| South Africa | 42 | 8381 | 28.80 | 14/ 42 |
| New Zealand | 29 | 5517 | 28.00 | 6/ 31 |
| Pakistan | 23 | 4131 | 27.91 | 4/ 24 |
During this period, much of West Indies' batting, and the runs they put up on the board, depended on the contributions of the three Ws. A good example of this was the fifth Test of the home series against Australia in 1955. In the first innings West Indies were bowled out for 357, of which 272 came from the bats of Walcott (155), Worrell (61) and Weekes (56). In the second innings Walcott scored another century, and in all the three Ws contributed 430 out of West Indies' match total of 676. West Indies, though, lost the match by an innings and 82 runs.
Though their middle order was so much better than those of the other sides, West Indies' overall results in this era were not outstanding: they won 17 and lost 15 out of 49 Tests, and their win-loss ratio was third-best, behind Australia, who were far superior, and England. Apart from the middle order, the other aspects of West Indies' team weren't the best: Australia and England had better openers, while four teams - Australia, England, South Africa and Pakistan - had better bowling attacks: West Indian bowlers only averaged 32.73 runs per wicket compared to Australia's 26.10. But in terms of middle-order batting, no team came close to West Indies' classy line-up.
Apart from the considerable batting skills of the three Ws, opposition bowlers also got a first taste of bowling to a player who would become a giant of the game: Garry Sobers had a relatively slow start to his Test career, but in 1958 against Pakistan, he slammed three successive hundreds - including an unforgettable 365 not out - to announce himself on the world stage. Among middle-order batsmen who scored 1000 or more Test runs during that period, four of the top six best averages belonged to West Indians.
| Batsman | Tests | Runs | Average | 100s/ 50s |
| Garry Sobers | 15 | 1115 | 61.94 | 2/ 6 |
| Clyde Walcott | 40 | 3639 | 61.67 | 15/ 13 |
| Everton Weekes | 46 | 4235 | 58.01 | 14/ 19 |
| Lindsay Hassett | 25 | 2114 | 57.13 | 8/ 7 |
| Vijay Hazare | 24 | 1985 | 56.71 | 7/ 9 |
| Frank Worrell | 30 | 2302 | 54.80 | 7/ 10 |
| Neil Harvey | 52 | 4351 | 53.71 | 16/ 16 |
| Dudley Nourse | 15 | 1242 | 51.75 | 4/ 5 |
| Peter May | 44 | 3083 | 47.43 | 8/ 16 |
| Denis Compton | 55 | 3941 | 46.36 | 9/ 20 |
What stands out about this West Indian middle order was its numbers in comparison with other middle orders during that era. There have been other great middle-order combinations in Test cricket, but never has this sort of superiority been replicated. Even during Bradman's time, Australia's middle order was about 15% better than their nearest competitor: Australia's Nos. 3-6 averaged 50.98 in 60 Tests during Bradman's time, while England's middle order, which was the next-best, averaged 44.34.
| Team | Tests | Runs | Average | 100s/ 50s |
| Australia | 60 | 17,234 | 50.98 | 49/ 66 |
| England | 105 | 27,585 | 44.34 | 73/ 111 |
| West Indies | 23 | 5375 | 34.90 | 13/ 20 |
Here's a look at some of the other powerful middle-order combinations over the years. Every era has had at least one team - though generally more - of high-class middle-order batsmen. In the 1960s, for instance, West Indies' line-up of Sobers, Rohan Kanhai and Co was still the best in the business, but the difference was that they weren't as far ahead of the competition as the three Ws had been. In fact, the top three middle-order run-getters during that era were all from England: Ken Barrington, Colin Cowdrey and Ted Dexter all scored more than 3000 runs, with Barrington scoring 5548 runs at 62.33. In all, England's middle order average 44.75, with South Africa (41.57) and Australia (40) also touching the 40-mark.
Between 1972 and 1976, Australia's top-class middle-order line-up averaged 46.38, but Pakistan (46.14) and West Indies (44.38) were close behind. That was the period when the Chappell brothers led the way, scoring more middle-order runs than any other batsmen, and at 50-plus averages too.
In the seven-year period between 1978 and 1984, though, middle-order runs were far more difficult to score, with only Pakistan averaging more than 40. West Indies, with an average of 39.80, were almost four runs behind Pakistan's 43.65. West Indies were clearly the best side in the 1980s, but their middle order was at its best in the early 1990s, when they averaged 45.60, a run and a half better than Australia's 44.03. Soon, though, Australia moved quite emphatically to the top, and their middle order played a significant role in that: they averaged almost 50. But that was also the period when five teams averaged more than 40. That has increased to seven teams over the last eight years, which is telling proof of how the game has changed: during the days of the three Ws, only one team topped 40. From 2002 to 2010, Sri Lanka's middle order was the most prolific, followed by India's heavyweight line-up. The list of top middle-order batsmen during this period has all the usual suspects.
One way to capture the increased dominance of batsmen over the last decade is to look at the overall top-order averages during each of those periods, and then compare those with the middle-order numbers for the top sides in each era. That comparison shows that even though other middle orders have higher averages over the last 15 years, in terms of the ratio no line-up has topped the West Indies team of the three Ws.
| Team | Period | Main batsmen | Middle Order ave | Overall top-order ave* | Ratio |
| West Indies | Jan 21, 1948-Mar 26, 1958 | Weekes, Worrell, Walcott | 47.99 | 34.64 | 1.39 |
| West Indies | Jan 1961-Dec 1970 | Sobers, Kanhai, Butcher, Nurse | 46.57 | 36.58 | 1.27 |
| Australia | Jan 1972-Dec 1976 | Greg & Ian Chappell, Doug Walters | 46.38 | 38.20 | 1.21 |
| Pakistan | Jan 1978-Dec 1984 | Miandad, Zaheer | 43.65 | 35.20 | 1.24 |
| West Indies | Jan 1991-Dec 1996 | Lara, Richardson, Adams, Hooper | 45.60 | 35.50 | 1.28 |
| Australia | Jan 1999-Dec 2007 | Ponting, Martyn, Steve & Mark Waugh | 49.68 | 37.63 | 1.32 |
| Sri Lanka | Jan 2002-Dec 2010 | Sangakkara, Jayawardene, Samaraweera, Dilshan | 50.58 | 39.29 | 1.29 |
| India | Jan 2002-Dec 2010 | Dravid, Tendulkar, Laxman, Ganguly | 48.10 | 39.29 | 1.22 |
In fact, among No. 4 batsmen who've scored at least 2000 runs at that slot, only Jacques Kallis (65.24) has a higher averaged than Weekes' 63.62. The table below lists the top No. 4 averages (with a 3000-run cut-off).
| Batsman | Tests | Runs | Average | 100s/ 50s |
| Jacques Kallis | 92 | 7895 | 65.24 | 30/ 33 |
| Everton Weekes | 37 | 3372 | 63.62 | 11/ 17 |
| Greg Chappell | 54 | 4316 | 59.12 | 15/ 19 |
| Sachin Tendulkar | 160 | 12,536 | 57.50 | 44/ 51 |
| Mahela Jayawardene | 98 | 7989 | 57.47 | 26/ 29 |
Worrell and Walcott, on the other hand, batted mostly at No. 3 or 5, and their averages figure in the top 10 among batsmen who've scored at least 2000 runs in those positions.
The three Ws did score their runs in an era when scoring them was generally more difficult, but even so, they did enjoy their time against the relatively weak bowling teams of the time. Weekes and Worrell both averaged less than 40 against Australia, but feasted on the Indian attack: Weekes averaged 106.78 in 10 Tests, and scored more runs off India than any other team, while Worrell averaged almost 61 against India, and 116.50 in two Tests against New Zealand. Walcott's record was more consistent, with an average of 57 against Australia - including centuries in each innings in two Tests in 1955 - and more than 44 against all sides.
The home-and-away stats, though, were especially skewed for Walcott and Weekes. Walcott averaged almost 30 more at home than he did away (69.83 to 40.46), while for Weekes the difference was almost 20 (69.14 at home, 49.63 away). For Worrell, the numbers were a little more balanced - 55.41 at home, and 44.90 away.
Tests that the three Ws played together
There were 29 Tests that Weekes, Worrell and Walcott played together, and in those matches Worrell was the only one to average more than 50 (even though in terms of overall career stats he was the only one among the three to average less than 50). West Indies, though, didn't have a very successful time in those games, winning seven Tests and losing 12. Against Australia, they lost six out of seven matches, which perhaps isn't so surprising given that both Weekes and Worrell averaged less than 40 against them.
There were 29 Tests that Weekes, Worrell and Walcott played together, and in those matches Worrell was the only one to average more than 50 (even though in terms of overall career stats he was the only one among the three to average less than 50). West Indies, though, didn't have a very successful time in those games, winning seven Tests and losing 12. Against Australia, they lost six out of seven matches, which perhaps isn't so surprising given that both Weekes and Worrell averaged less than 40 against them.
| Batsman | Tests | Runs | Average | 100s/ 50s |
| Frank Worrell | 29 | 2443 | 51.97 | 7/ 10 |
| Clyde Walcott | 29 | 2290 | 49.78 | 9/ 8 |
| Everton Weekes | 29 | 2314 | 47.22 | 6/ 12 |
S Rajesh is stats editor of ESPNcricinfo. Follow him on Twitter