Cricket's newest format touches 200
A look at the numbers from the previous 199 Twenty20 internationals
S Rajesh
03-Jun-2011
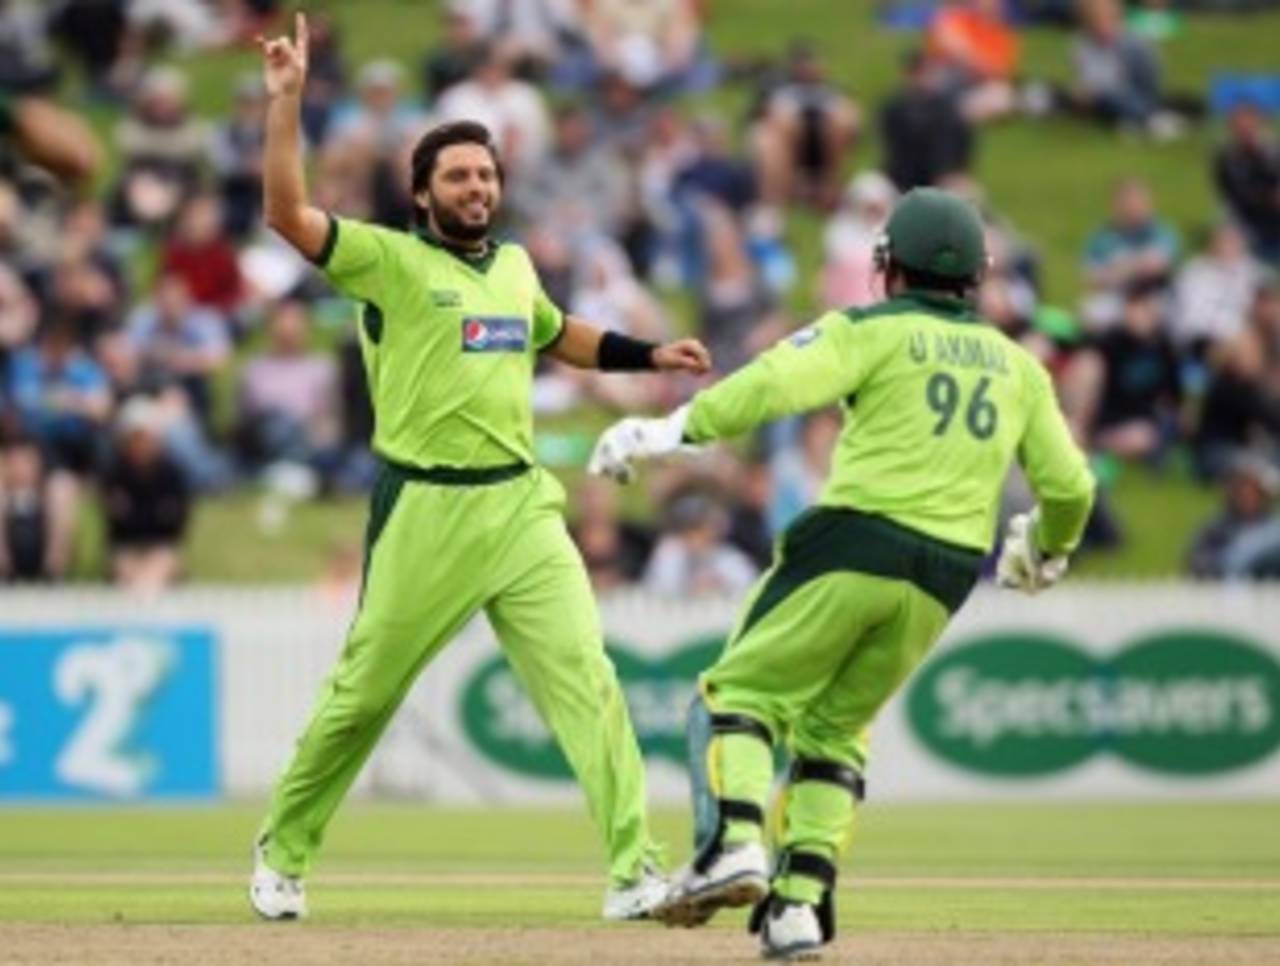
Pakistan's aggression has suited the Twenty20 format perfectly - they've played, and won, more Twenty20 internationals than any other side • AFP
On February 17, 2005, the first Twenty20 international match was played between Australia and New Zealand, a match which Australia won by 44 runs. More than six years later, West Indies will take on India in the 200th game of this format, which means, on an average, about 32 Twenty20 internationals have been played per year. The ICC has said in the past that it doesn't want to overdo this format, and so far they seem to be sticking to that promise, given that 932 ODIs have been played in the same period.
A year-wise look at the matches shows that most Twenty20 internationals have been played as part of the World Twenty20. There have been three editions so far - in 2007, 2009 and 2010 - each consisting of 27 matches, which means 81 out of 199 games have been played in these three tournaments. In fact, out of 66 different Twenty20 series, half have consisted of one-off games; there have been 24 two-match series, and only nine - including the three World twenty20s - have been played over three or more matches.
The run-rates have been pretty constant each year from 2005, with the only dip coming in 2008, when the run-rate and average dipped alarmingly. That's largely because of the World Twenty20 Qualifier in Belfast, when teams averaged a measly 5.34 runs per over and 13.82 runs per wicket over 11 matches. The three World Twenty20s themselves have pretty similar numbers, with the first one having a slightly higher run-rate than the two more recent ones.
| Year | Matches | Average | Run-rate |
| 2005 | 3 | 18.93 | 8.11 |
| 2006 | 9 | 21.21 | 7.64 |
| 2007 | 38 | 22.82 | 7.99 |
| 2008 | 29 | 17.13 | 6.55 |
| 2009 | 48 | 23.26 | 7.80 |
| 2010 | 68 | 20.56 | 7.28 |
| 2011 | 4 | 21.28 | 7.58 |
| Overall | 199 | 21.11 | 7.48 |
A team-wise look at Twenty20 internationals shows that Pakistan have played the most number of matches, even as they've been starved of Test cricket during this period. They also have a high win-loss ratio, second only to South Africa, who have by far the best ratio despite not reaching even the final of a single World Twenty20. Six of the top eight teams have won more matches than they've lost, and one of the reasons for this is the fact that many lesser teams play this format far more often than they do ODIs. In all 17 countries have played Twenty20 internationals, including Ireland (17 games), Netherlands (10), Afghanistan (8), Kenya (12), Canada (11), Scotland (12) and Bermuda (3). In fact, out of 199 Twenty20 internationals so far, 48 have involved teams outside the nine Test-playing sides and Zimbabwe; and 60 have involved teams outside the nine Test-playing ones.
| Team | Matches | W/ L | Ratio | v top 10 teams - Matches | W/ L | Ratio |
| South Africa | 38 | 25/ 13 | 1.92 | 36 | 23/ 13 | 1.76 |
| Pakistan | 46 | 27/ 18 | 1.50 | 41 | 22/ 18 | 1.22 |
| Sri Lanka | 34 | 20/ 14 | 1.42 | 31 | 17/ 14 | 1.21 |
| India | 28 | 15/ 11 | 1.36 | 25 | 13/ 11 | 1.18 |
| Australia | 41 | 22/ 17 | 1.29 | 41 | 22/ 17 | 1.29 |
| England | 36 | 18/ 16 | 1.12 | 34 | 18/ 15 | 1.20 |
| New Zealand | 43 | 19/ 21 | 0.90 | 40 | 16/ 21 | 0.76 |
| West Indies | 29 | 12/ 15 | 0.80 | 28 | 11/ 15 | 0.73 |
| Zimbabwe | 14 | 3/ 10 | 0.30 | 12 | 2/ 10 | 0.20 |
| Bangladesh | 16 | 3/ 13 | 0.23 | 14 | 2/ 12 | 0.16 |
The country that has hosted the most Twenty20 internationals is South Africa, with 42. The two others to have hosted the World Twenty20, England and West Indies, are the only ones apart from South Africa to have hosted more than 30. India, on the other hand, have hosted only three Twenty20 internationals, but they're also the only country where the average run-rate is more than nine per over - in fact, it's touching ten. (Click here for stats by host country.)
IPL v Twenty20 internationals
India, though, have been busy hosting three seasons of the IPL - the club-based format has seen 248 matches across all four seasons, including the one which was hosted by South Africa. Overall, the IPL has a higher run-rate, but the bigger difference is the number of centuries scored - in 199 Twenty20 internationals, there have been only four, but in 248 IPL games there've been 18.
| Matches | Average | Run-rate | 100s | |
| IPL | 248 | 25.44 | 7.90 | 18 |
| Twenty20 internationals | 199 | 21.11 | 7.48 | 4 |
More numbers
- Brendon McCullum is the only batsman to score more than 1000 runs in Twenty20 internationals - he has scored 1100 runs at an average of 33.33 and a strike rate of 128.35. Graeme Smith is next with 958. Among batsmen who've scored at least 500, Yuvraj Singh has the highest strike rate (151.60), while Kevin Pietersen has the highest average (36.03). (Click here for the list of highest run-getters.)
S Rajesh is stats editor of ESPNcricinfo