Trial by spin awaits New Zealand
New Zealand have done superbly to get this far in the World Cup, but can they conquer Sri Lanka's spinners in Colombo?
S Rajesh
28-Mar-2011
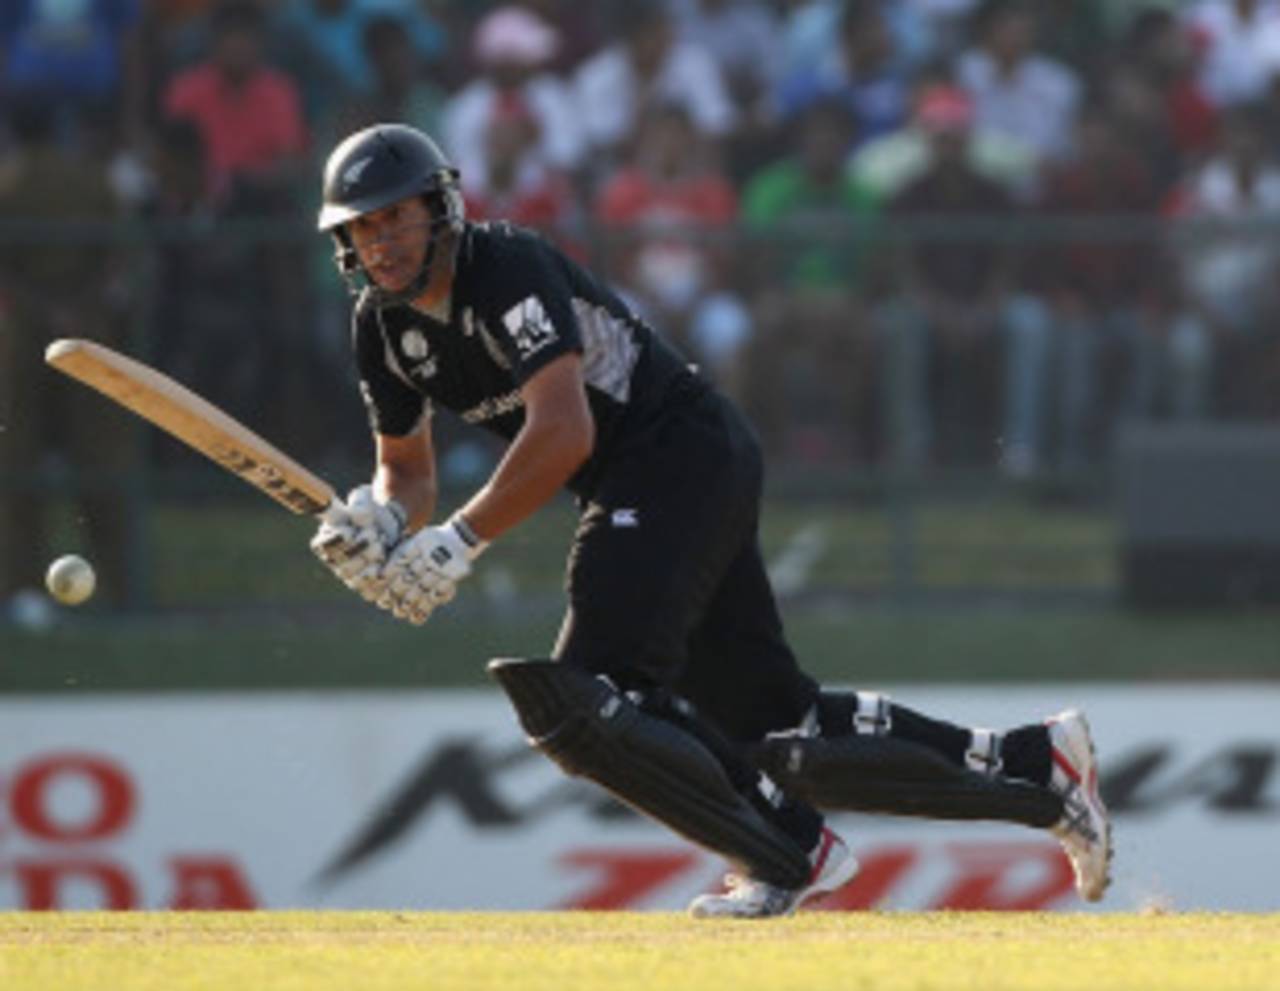
Ross Taylor has a scoring rate of 7.20 runs per over against the seamers, but against spin it drops to 3.97 • Getty Images
Almost any way you look at it, Sri Lanka start off as huge favourites in their semi-final clash against New Zealand. They've been one of the form teams of this tournament, having lost only to Pakistan so far; they thrashed New Zealand by 112 runs in the group game only ten days ago; and they're playing at home, in conditions which should be ideal for spin bowling.
In contrast, New Zealand have little going in their favour. They've reached their sixth World Cup semi-final, but they've also lost each of their previous five, including one to Sri Lanka by 81 runs in 2007. The only aspect that perhaps works in their favour is the fact that Sri Lanka's batting has relied heavily on Kumar Sangakkara and Mahela Jayawardene, and in the last two World Cup matches between the two teams, they've both scored a hundred each - Jayawardene in Kingston and Sangakkara in Mumbai. New Zealand may feel they're due a game when neither gets a big score, and then they might get a chance to exert pressure on the others - in the Mumbai game, Angelo Mathews was the only other batsman to make a double-digit score.
The overall numbers, though, are strongly in Sri Lanka's favour, especially recently: since 2000, they've lost only one of eight home games against New Zealand. New Zealand have won three out of eight in World Cups, but they've lost each of the last four, since the 2003 edition. And unlike New Zealand's dismal semi-final record, Sri Lanka have won two out of three - the only one they lost was in 2003 to Australia.
| Matches | SL won | NZ won | |
| Overall | 73 | 33 | 35 |
| In SL | 19 | 12 | 5 |
| Since 2000 | 33 | 20 | 11 |
| Since 2000 in SL | 8 | 6 | 1 |
| in World Cups | 8 | 5 | 3 |
The overall stats for the two teams against the other top sides in this tournament shows the gulf, especially in the batting line-ups: Sri Lanka average more than 43 runs per wicket compared to New Zealand's 25.20. Sri Lanka's top three are among the five highest run-getters in this tournament, and all of them have scored more than 350 runs at a 60-plus average.
New Zealand's highest run-getter is Ross Taylor with 288, but he is the only one to score more than 250 for them. The only aspect where New Zealand are well clear of Sri Lanka is in clearing the boundary - they've hit 34 sixes to Sri Lanka's 12. In fact, Taylor alone has struck 14, which is more than what the entire Sri Lankan team has managed.
| Team | Runs | Bat ave | Run-rate | Wickets | Bowl ave | Econ rate |
| Sri Lanka | 908 | 43.23 | 5.26 | 23 | 28.65 | 4.88 |
| New Zealand | 882 | 25.20 | 4.89 | 32 | 26.12 | 4.94 |
A key for both teams could be their opening batting. Sri Lanka and New Zealand have among the most successful opening combinations of the tournament. New Zealand's big stands have come against the weaker teams, but Dilshan and Tharanga put together 231 against England, which was their second double-century stand of this World Cup, after the 282 they added against Zimbabwe. They're the first opening pair to put together two double-century stands in the same World Cup, and with Sangakkara and Jayawardene to follow, Sri Lanka's batting will again depend heavily on their top four. Apart from those four, none of the other Sri Lanka batsmen have managed 100 runs in the tournament so far.
The spin test
One of the keys to the game will obviously be the way the two teams tackle spin. Sri Lanka are quite used to batting against spin and bowling a lot of it, but for New Zealand's batsmen, especially, it could be a huge trial. In the tournament so far, they've averaged less than 4.50 runs per over against spin, which is much lower than the rate for Sri Lanka. Taylor has been exceptional against pace, averaging more than seven runs per over, but he has fallen to spinners three times, and his scoring rate against them is less than four runs per over. Only two out of his 14 sixes in the tournament have been scored off spinners.
One of the keys to the game will obviously be the way the two teams tackle spin. Sri Lanka are quite used to batting against spin and bowling a lot of it, but for New Zealand's batsmen, especially, it could be a huge trial. In the tournament so far, they've averaged less than 4.50 runs per over against spin, which is much lower than the rate for Sri Lanka. Taylor has been exceptional against pace, averaging more than seven runs per over, but he has fallen to spinners three times, and his scoring rate against them is less than four runs per over. Only two out of his 14 sixes in the tournament have been scored off spinners.
| Team | Runs | Dismissals | Average | Run rate |
| Sri Lanka | 667 | 12 | 55.58 | 5.57 |
| New Zealand | 619 | 17 | 36.41 | 4.37 |
| Against | Runs | Balls | Dismissals | Average | Run-rate | 4s/ 6s |
| Pace | 174 | 145 | 1 | 174.00 | 7.20 | 14/ 12 |
| Spin | 114 | 172 | 3 | 38.00 | 3.97 | 5/ 2 |
Sri Lanka's spinners too have been more incisive, with 26 wickets in the tournament compared to New Zealand's 11. Muttiah Muralitharan is Sri Lanka's leading wicket-taker with 13 at an average of 16.15 and an economy rate of 3.96, but New Zealand's best spinner, Daniel Vettori, has struggled for wickets. In four innings he has only managed two, and while his economy rate is excellent - he has conceded 3.60 runs per over - he averages 59.50 runs per wicket. Nathan McCullum has done a fair job of bowling with the new ball and maintaining tight control - he has taken eight wickets at 26, and an economy rate of 4.72.
| Team | Wickets | Average | Econ rate |
| Sri Lanka | 26 | 18.50 | 3.63 |
| New Zealand | 11 | 33.54 | 4.22 |
S Rajesh is stats editor of ESPNcricinfo