Beyond bowling averages
Why Siddle and Herath are special. And why some bowlers are better at dismissing the tail than others
Kartikeya Date
20-Dec-2013
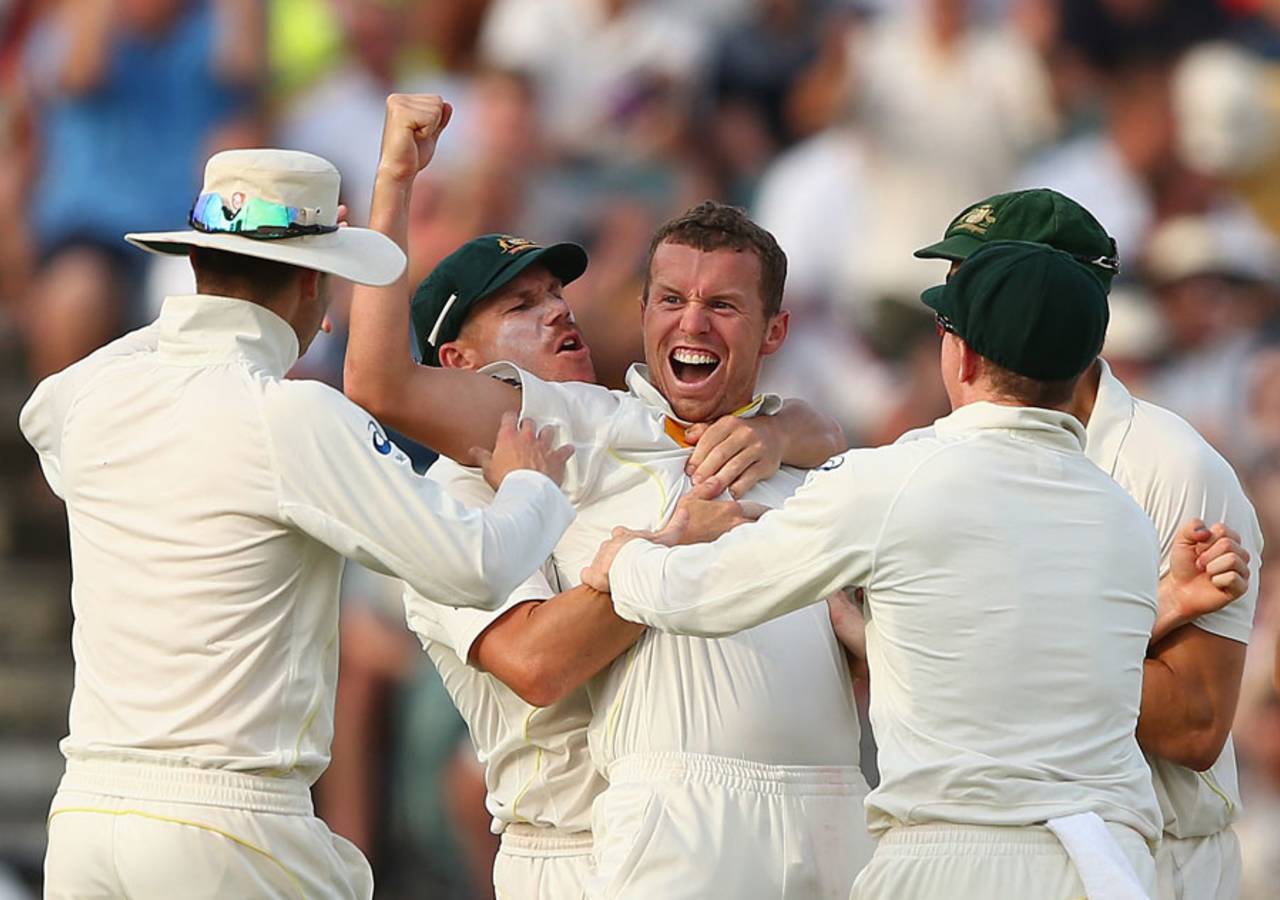
A majority of batsmen dismissed by Peter Siddle have averaged more than 35 at the time • Getty Images
What does a bowling average show? And more importantly, what does it hide? What does it mean when two very different bowlers, R Ashwin and Peter Siddle, average in the 28-30 range? Each is effective in very different conditions, and perhaps against batsmen with different strengths and weaknesses.
The bowling average and strike rate provide a good entry point into understanding cricketers and their cricket. It can be safely argued that a bowler averaging 35 in Tests is not a very good Test match bowler, while one who averages 25 probably is. But beyond that, what can we learn?
In this post, the first of a three-part series, I present two measures that tell us a little bit more. But before I detail these measures, a word on how I hope these statistics will be read. My purpose with these measures is not to say one bowler is better than the other, but to show how differences between bowlers are visible in their records. In this post, I consider all contemporary bowlers who have taken at least 100 Test wickets.
Statistics are revealing. The fact that Shivnarine Chanderpaul has played 151 Tests for West Indies from 1994 to 2013, and scored 11,040 runs at 51.58 with 28 centuries and 62 fifties tells us a lot about Chanderpaul, but it tells us more if we also know that in doing so, he scored 16% of all the runs made by West Indies. It tells us even more, if we also know that from 1995 to 2012, Ricky Ponting made 13,378 runs at 51.85 with 41 centuries and 62 fifties for Australia, and this accounted for 14.4% of Australia's runs. How we choose to read measurements has a big role to play in what we learn from them. To say that Ponting was a better batsman than Chanderpaul based on a comparison of their records is perhaps the most boring thing that can be read from these numbers.
I have calculated the batting average of every single batsman at the start of each Test innings. Using this, I have built a record of the batting average of each wicket a bowler has taken. Column's B and C in the table above show the distribution of each bowler's wickets in two categories - batsmen who averaged less than 35 at the time, and batsmen who averaged more than 35. I use this distribution because I think batting average is a more reliable measure of quality than batting position. For example, how does one compare the batting ability of Matt Prior (41) and Chris Rogers (32)? Conventionally, one would consider an opener's wicket more valuable than a wicketkeeper's, but is that sufficient?
I also looked at the score for which the bowler dismissed each batsman. I propose that the ultimate ambition of a bowler in Test cricket is to dismiss a batsman who has a healthy batting average as early as possible. A bowler can do little better in a Test innings than to dismiss a batsman who averages 50 in Tests at that time, for a duck. Some bowlers do this more often than others.
Column H provides the number of batsmen (with average better than 35), who have been dismissed for a score below 35. In Column I, each bowler's strike rate for these dismissals is presented. I will refer to this as the bowler's Specialist Strike Rate. It tells us how often a bowler dismisses a specialist batsman cheaply.
In Column G, I provide my second measure beyond bowling averages - the batting average of the median wicket for each bowler. I will refer to this as Median.
All the bowlers in this list are contemporary bowlers. They have all played against more or less the same teams. Siddle's Median wicket averaged 38 in Tests. Ashwin's averaged 29.7. Irfan Pathan, whose Test record looks as good as it does thanks to a larger number of cheap Bangladeshi Test wickets, has a Median wicket of 27.0. Two-thirds of the Test wickets taken by Ashwin and Pathan averaged less than 35 with the bat. A majority of Test wickets taken by Zaheer Khan, Mohammad Asif and Siddle averaged more than 35.
A reasonably clear pattern is evident in these figures. Fast bowlers, who get first crack at openers and top-order batsmen with the new ball, seem to get a higher share of batsmen with high averages. Spinners make up the lower end of the list as a rule.
The exceptions to this are the two Sri Lankans - Rangana Herath and Lasith Malinga. Malinga's ability to attack the stumps accounts to some extent for his brilliance against tailenders and his limitations against top-order players (especially top-order players who have gotten used to his low release). Herath is perhaps the most underrated spinner of his era, not least because he played in Muttiah Muralitharan's shadow, and then was inexplicably selected behind Suraj Randiv for a few Tests. His relentless accuracy and subtle variations have made him a formidable competitor against the top order as well as tailenders.
I will conclude by saying that this clear pattern suggests a limitation of fast bowlers in this list, rather than point to a structural advantage in their favour. Look at Dale Steyn's record. Steyn is the most complete fast bowler of his generation. He dismisses a batsman cheaply once every 148 deliveries, and yet, these wickets account for only about two out of five taken by him. The tail demands attention in cricket, and for reasons of endurance and ability, very few fast bowlers are good both at dismissing specialist batsmen and dismissing tailenders.
In the next post, I turn my attention to Test spinners from the 1990s and 2000s. In the concluding post of this three-part series, I will focus on top fast bowlers in the modern era.