What third-innings scores can tell us about batsmen
Whether dealing with a lead or deficit, they are a better measure of a batsman's ability than first- or fourth-innings scores
Kartikeya Date
Aug 5, 2017, 3:35 AM
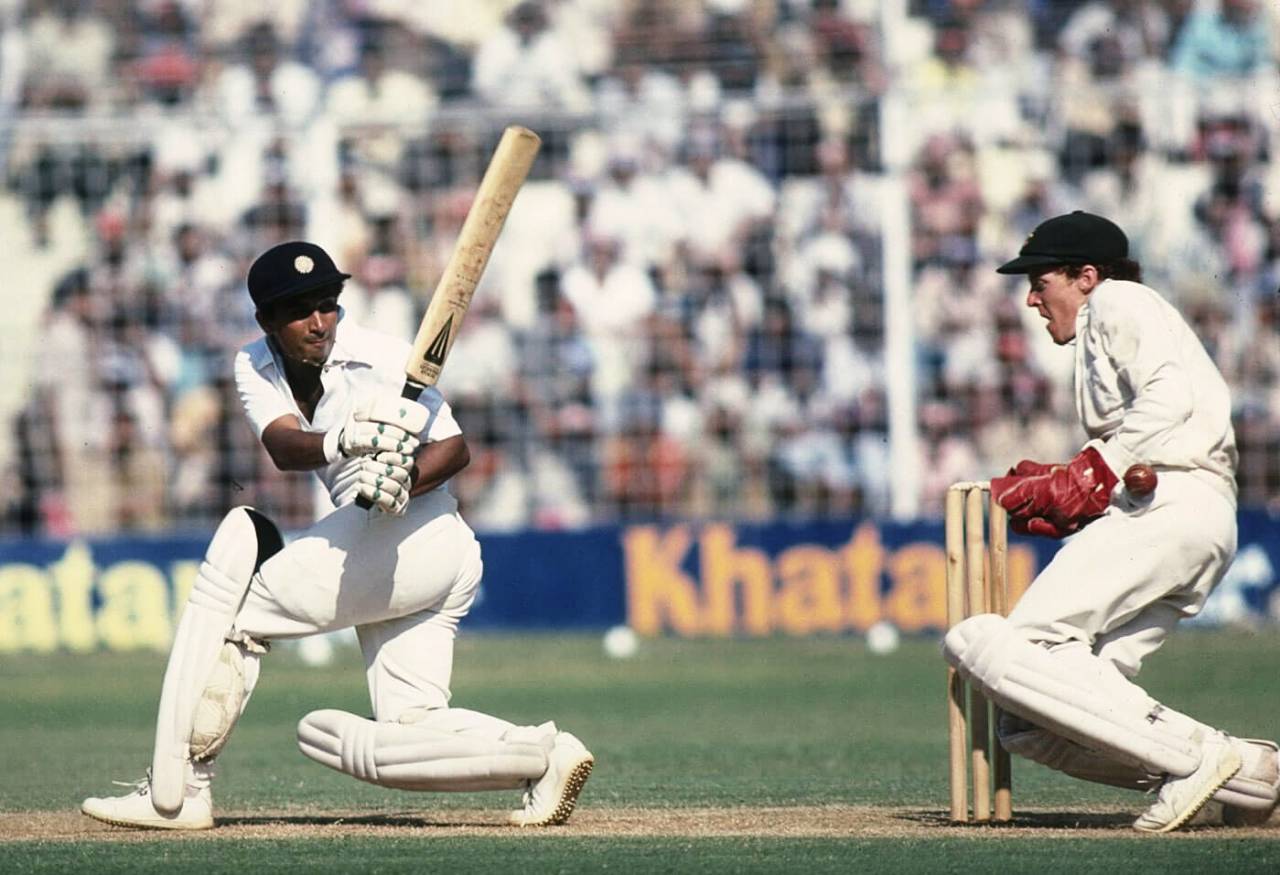
Sunil Gavaskar had to bat his team out of trouble in the third innings far more often than coming into situations where India held the upper hand • Adrian Murrell/Getty Images
The existence of the draw as a valid result makes batting and bowling asymmetrical skills in unlimited-overs (four-innings) cricket. In first-class and Test cricket, bigger individual scores do not guarantee a higher chance of an outright win, but they do guarantee a lower probability of outright defeat. By contrast, bigger individual wicket hauls (in the innings or in the match) guarantee a higher probability of outright wins.
This central asymmetry means that batsmen and bowlers are not equally capable of producing "match-winning" performances. In fact, the overwhelming majority of batting performances in first-class or Test cricket are concerned with setting matches up or saving them. Low scores can at most be said to fail to set matches up or to save them.
The implication these structural facts have for unlimited-overs cricket is that first-innings batting becomes the most significant type of batting. There is a temptation for fans to look at fourth-innings records to compare players, but these records tell us almost nothing about the value of a player, or even of the skill of a player.
For one thing, the sample sizes are small. Sachin Tendulkar has scored more runs than any other player in the fourth innings of Tests, but that's only 1625 runs.
For another, fourth innings can vary wildly in terms of playing conditions. The batting side could be chasing 120 or 600. There is no way to compare these two situations.
In the first innings, the terms of the game are not yet set. The conditions are more or less even. And first-innings leads are decisive. The team with the first-innings lead in a Test has won 1273 and lost 230 matches.
This leaves us with the third innings. The third innings is the batting team's chance to save a Test match by overcoming a first-innings deficit. The wicket is usually not worn out, and third innings largely occur on the third and fourth days of Tests. The team batting third also has a realistic target to play for. If they turn a deficit of, say, 120 into a lead 200, then not only have they changed the shape of the match, they have given their bowlers something to defend on the wearing wicket in the fourth innings. The third innings is the one realistic chance teams have of overcoming the tyranny of the first-innings deficit.
Third-innings batting occurs in a range of situations. A No. 4 batsman in the third innings could walk in at 80 for 2, but his team might effectively be 40 runs behind. In another third innings, the same batsman could walk in at the same score and his team could effectively be 200 for 2. The match situation at -40 for 2 and +200 for 2 is extremely different.
In the former case, the bowling side smells blood and feels, realistically, that a couple of quick wickets could well mean a fourth-innings chase of less than 100. In the latter case, the bowling team is probably 40 to 50 runs away from pushing the field back and waiting for a declaration.
Run-scoring and even survival in one of those scenarios are very different from the other for a batsman. Third-innings batting not only reveals something about the individual player's record, it also reveals something about the teams the player featured in.
The data presented below describes two sets of players. The first set involves all Indian Test batsmen in the top eight batting positions in the third innings of Tests in which India either conceded a first-innings lead or secured a first-innings lead. Players who featured in at least ten such innings are included in this set. The second set considers all Test players who featured in at least 25 such innings.
First, consider all Indian Test players in third innings where the team has conceded a first-innings lead. The sample sizes here are small, and so, small differences in average are not meaningful.
Here is an informal way to understand what "small" means. Suppose a player scored 400 runs over ten innings and averaged 40 (there are zero not- outs). If the player scores 0 in the 11th innings, the average would drop by 9%, or 3.6 runs. Suppose the player scored 80 (double the average) in the 11th innings, the average would increase to 43.6. So, over ten innings, an average of 40 is probably not significantly different from an average that is between 36.4 and 43.6. Over 25 innings, an average of 40 is not significantly different from an average of between 38.4 and 41.6. And so on. Mathematical techniques exist to calculate whether or not two averages are significantly different, but this is a simple way to think of what an average tells us.
| Player | Innings | Runs | Average | 100s | 50s |
| Sunil Gavaskar | 34 | 1821 | 58.7 | 5 | 11 |
| Sachin Tendulkar | 32 | 1678 | 59.9 | 7 | 7 |
| Dilip Vengsarkar | 31 | 1019 | 40.8 | 3 | 4 |
| Rahul Dravid | 29 | 1089 | 38.9 | 2 | 5 |
| Gundappa Viswanath | 25 | 1099 | 47.8 | 3 | 5 |
| Kapil Dev | 24 | 636 | 30.3 | 2 | 0 |
| VVS Laxman | 22 | 879 | 46.3 | 2 | 5 |
| Polly Umrigar | 22 | 751 | 35.8 | 1 | 4 |
| Pankaj Roy | 20 | 775 | 38.8 | 2 | 5 |
| Sourav Ganguly | 19 | 666 | 41.6 | 0 | 5 |
| Ravi Shastri | 18 | 368 | 24.5 | 1 | 0 |
| Virender Sehwag | 18 | 588 | 32.7 | 1 | 3 |
| Mohinder Amarnath | 18 | 929 | 58.1 | 3 | 6 |
| Vijay Manjrekar | 17 | 517 | 30.4 | 1 | 4 |
| Syed Kirmani | 17 | 280 | 21.5 | 0 | 1 |
| Chandu Borde | 17 | 434 | 27.1 | 0 | 3 |
| Mohammad Azharuddin | 15 | 529 | 35.3 | 3 | 1 |
| Vinoo Mankad | 15 | 556 | 50.5 | 1 | 3 |
| MS Dhoni | 15 | 387 | 27.6 | 0 | 4 |
| Farokh Engineer | 14 | 470 | 33.6 | 0 | 4 |
| Anshuman Gaekwad | 14 | 396 | 33 | 0 | 4 |
| Ajit Wadekar | 13 | 452 | 37.7 | 0 | 4 |
| Nawab of Pataudi | 12 | 453 | 41.2 | 1 | 3 |
| Vijay Hazare | 12 | 524 | 47.6 | 2 | 2 |
| Yashpal Sharma | 11 | 185 | 20.6 | 0 | 1 |
| Virat Kohli | 11 | 173 | 15.7 | 0 | 1 |
| Chetan Chauhan | 11 | 516 | 46.9 | 0 | 5 |
| Eknath Solkar | 11 | 213 | 21.3 | 0 | 1 |
| Gautam Gambhir | 11 | 458 | 41.6 | 1 | 3 |
| Anil Kumble | 11 | 131 | 14.6 | 0 | 0 |
| Bapu Nadkarni | 10 | 217 | 31 | 0 | 1 |
| GS Ramchand | 10 | 325 | 36.1 | 2 | 0 |
| Nari Contractor | 10 | 297 | 33 | 0 | 2 |
| Dilip Sardesai | 10 | 167 | 16.7 | 0 | 1 |
| Sanjay Manjrekar | 10 | 212 | 21.2 | 0 | 1 |
The list of Indian players who featured in at least ten third innings in which India had taken a first-innings lead is significantly shorter. The records of all the players in this list who also appear in the list above have been added to the table below.
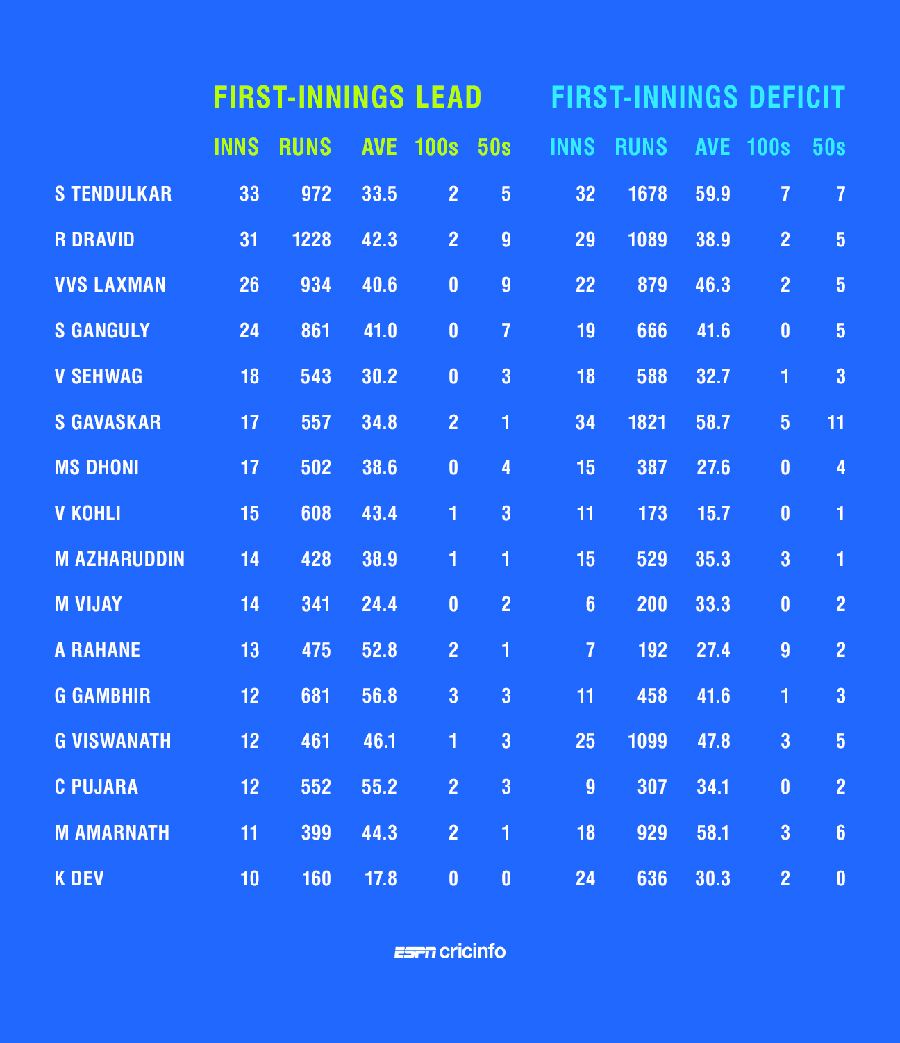
The two outstanding exceptions in the table above are Sunil Gavaskar and Tendulkar. Both these players excelled in situations where India had to overcome a first-innings deficit. By contrast, they were well below par in situations where India had to build on a first-innings lead.
But the similarity in their records ends here. Gavaskar batted twice as often in third innings battling a deficit as he did backed by a first-innings lead. Tendulkar was equally likely to face a deficit or a lead. This tells us something about the relative strengths of the teams Gavaskar and Tendulkar played in. The current Indian top order - Virat Kohli, Cheteshwar Pujara, Ajinkya Rahane and M Vijay - also feature in this list. These batsmen play less often in the third innings with a deficit than they do with a lead. They have not yet distinguished themselves in this area.
The all-time list of Test players who have played at least 25 third innings in which their team faces a first-innings deficit is below.
| Player | Team | Innings | Runs | Average | 100s | 50s |
| Allan Border | Australia | 37 | 1947 | 72.1 | 6 | 11 |
| Kumar Sangakkara | Sri Lanka | 32 | 1840 | 61.3 | 7 | 8 |
| Sunil Gavaskar | India | 34 | 1821 | 58.7 | 5 | 11 |
| Sachin Tendulkar | India | 32 | 1678 | 59.9 | 7 | 7 |
| Jacques Kallis | South Africa | 30 | 1560 | 60 | 4 | 9 |
| Brian Lara | West Indies | 36 | 1526 | 42.4 | 6 | 4 |
| Geoff Boycott | England | 31 | 1424 | 52.7 | 4 | 9 |
| Graham Gooch | England | 39 | 1419 | 37.3 | 3 | 5 |
| David Gower | England | 34 | 1390 | 49.6 | 4 | 5 |
| Younis Khan | Pakistan | 32 | 1366 | 44.1 | 4 | 4 |
| Alastair Cook | England | 28 | 1317 | 50.7 | 5 | 5 |
| Brendon McCullum | New Zealand | 27 | 1277 | 49.1 | 2 | 6 |
| Shivnarine Chanderpaul | West Indies | 35 | 1270 | 42.3 | 2 | 10 |
| Alec Stewart | England | 38 | 1228 | 37.2 | 1 | 11 |
| Inzamam-ul-Haq | Pakistan | 26 | 1201 | 48 | 2 | 10 |
| Habibul Bashar | Bangladesh | 32 | 1168 | 37.7 | 1 | 10 |
| Colin Cowdrey | England | 27 | 1159 | 50.4 | 3 | 6 |
| Gundappa Viswanath | India | 25 | 1099 | 47.8 | 3 | 5 |
| Rahul Dravid | India | 29 | 1089 | 38.9 | 2 | 5 |
| Dilip Vengsarkar | India | 31 | 1019 | 40.8 | 3 | 4 |
| Andy Flower | Zimbabwe | 32 | 1002 | 37.1 | 1 | 6 |
| Javed Miandad | Pakistan | 26 | 921 | 38.4 | 2 | 6 |
| David Boon | Australia | 25 | 920 | 41.8 | 2 | 8 |
| Graeme Smith | South Africa | 26 | 849 | 34 | 1 | 6 |
| Javed Omar | Bangladesh | 29 | 772 | 27.6 | 0 | 5 |
| Mahela Jayawardene | Sri Lanka | 33 | 772 | 23.4 | 0 | 8 |
| Mike Atherton | England | 34 | 689 | 20.3 | 0 | 4 |
| Alistair Campbell | Zimbabwe | 27 | 681 | 25.2 | 1 | 4 |
| Stephen Fleming | New Zealand | 26 | 625 | 25 | 0 | 5 |
| Grant Flower | Zimbabwe | 29 | 559 | 20 | 0 | 2 |
| Mohammad Ashraful | Bangladesh | 28 | 550 | 21.2 | 2 | 0 |
| Khaled Mashud | Bangladesh | 28 | 375 | 15.6 | 0 | 0 |
There is a relationship between the types of challenges and match situations a Test player faces and the strength of the team he plays in.
Ricky Ponting faced a first-innings deficit in the third innings 20 times and averaged 29.6 over those 20 innings. He came in with a first-innings lead 54 times and averaged 43.3. By contrast, Allan Border faced a first-innings deficit in 37 third innings and averaged 72. He batted with a first-innings lead 30 times and averaged 63.4 over those 30 innings. It would be tempting to argue based on this (in addition to Ponting's and Border's overall career records) that Border was the better all-round batsman. He played in an Australia side that was, at least between 1978 and 1989, significantly weaker than the team Ponting played in. Border was confronted with difficult or perilous match situations more frequently than Ponting, and did well in almost all of them. This analysis is not without merit.
However, consider the fact that Ponting played with a very strong bowling attack in almost all types of conditions. Given the combined batting and bowling strength of this team, it would take something extraordinary for them to concede a first-innings lead (effectively, to "lose" on the first innings). Some opponent would have to be in extraordinary form, or the playing conditions would have to be exceptionally favourable to a particular style of bowling. All this suggests that the circumstances of the third innings in such matches would also be extraordinary. So, while it would still be true that Border faced more varied and more frequently perilous match situations than Ponting, it is possible that the conditions Ponting faced on average over those 20 innings in which his team faced a first-innings deficit were, on average, very difficult for batting.
In my view there is merit to both arguments. However, on balance, I favour the view that batsmen who play for weak teams have a more difficult job than batsmen who play for strong teams. As a result, when batsmen in the former category excel, they ought to be rated extremely highly.
Measuring and comparing players is interesting because the readily available measurements like averages, number of centuries and aggregates condense a large amount of detailed contextual information into a single dimension. Cricket records being what they are, it is possible to unpack these dimensions.
Batting in the first match innings remains the most significant feature of a player's record. But third-innings batting, when considered as it has been here, reveals not only how well (or otherwise) the player did in different match situations, but also how often the player was confronted by such situations.
It is said that cricket is really an individual sport pretending to be a team sport. This is not really true. Cricket is an individual sport in which the individual's fortunes are significantly shaped by the nature of the team.
Kartikeya Date writes at A Cricketing View. @cricketingview