The AB de Villiers T20I mystery
Despite his outstanding ball-striking skills, de Villiers' numbers in this format are decidedly ordinary
S Rajesh
11-Mar-2016
AB de Villiers has good numbers in the IPL, especially in the last four years, but in T20Is he has struggled to replicate that success • ESPNcricinfo Ltd
By all accounts, AB de Villiers is one of the finest batsmen going around today. His defensive technique is compact, he has all the shots in the coaching manual and then some, and he can completely adapt his game to suit his team's needs. In ODIs, he holds the record for the fastest fifty and the fastest century, but in Tests he features twice in the top five - and thrice in the top 15 - slowest innings of 200 or more deliveries. (His two slowest innings, at third and fifth place, flank Chris Tavare's effort which is at No. 4).
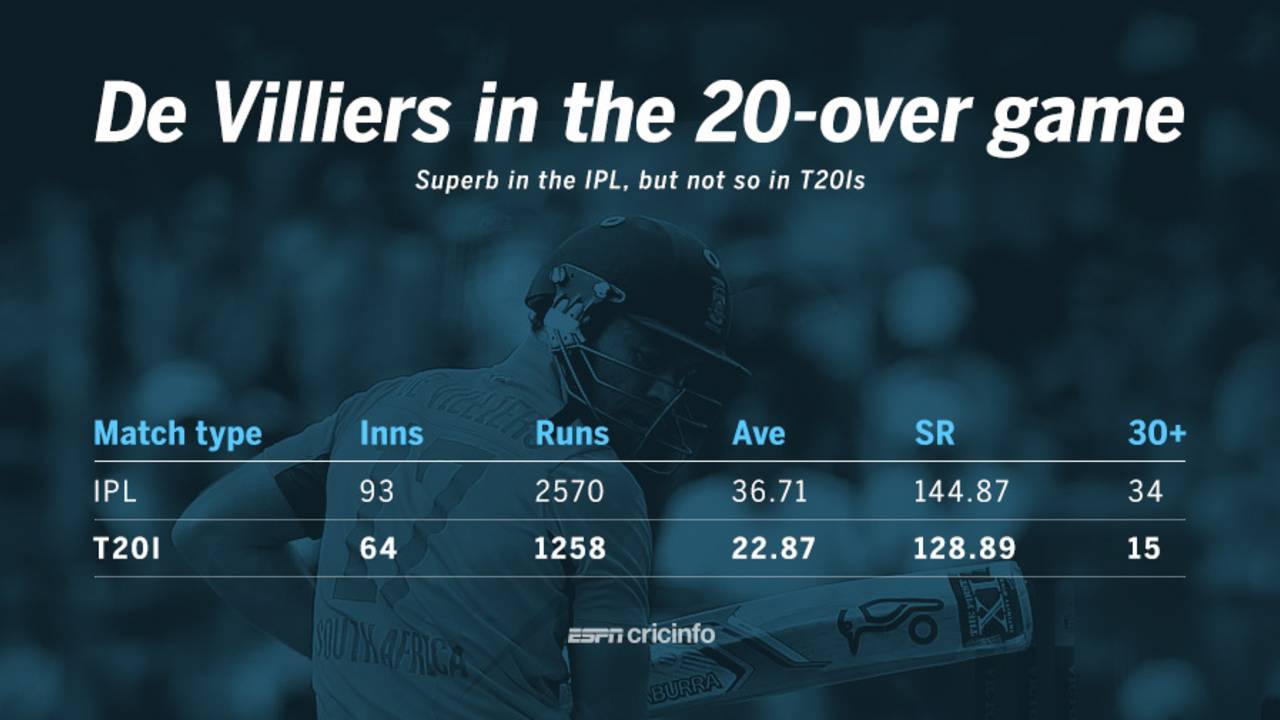
While his defensive abilities and temperament are top-class, it's his ability to innovate and his audacious strokeplay that is truly astonishing. Those skills should have served him well in the shortest format of the game, but his record in T20 internationals is decidedly underwhelming. In 64 innings he averages 22.87 at a strike rate of 128.89, with only 15 scores of 30 or more. Those are hardly numbers that do justice to his incredible skills as an attacking batsman. His ODI numbers indicate how destructive he can be: he averages almost 55 at a strike rate of 100.18, but his T20I strike rate is less than 30% higher than the ODI strike rate.
De Villiers' IPL numbers are much better - an average of 36.71 at a strike rate of nearly 145, with 34 thirty-plus scores in 93 innings - but he hasn't yet been able to translate his IPL success into consistent runs at the international level in the 20-over format.
| Type | Inngs | Runs | Ave | SR | 30+ | Inngs/30+ |
| IPL | 93 | 2570 | 36.71 | 144.87 | 34 | 2.74 |
| T20I | 64 | 1258 | 22.87 | 128.89 | 15 | 4.27 |
Even in the IPL, de Villiers' stats were solid without being extraordinary till 2011: an average of 33 at a strike rate of 121. Since the 2012 season, though, his numbers - especially the strike rate - have moved up a few notches. His strike rate in the last four seasons is 165.48, easily the best among the 44 batsmen who have faced at least 500 deliveries in the last four seasons of the IPL. (Chris Gayle is next with a rate of 149.22).
However, the IPL success during this period hasn't translated into more and quicker runs in international T20s. His average in the 32 T20Is since the start of 2012 isn't too different from the 32 innings before 2012, though the strike rate has improved a bit. In the last four seasons of the IPL, de Villiers has passed 30 once every 2.35 innings, compared to once every four innings in T20Is during this period.
| Period | Inngs | Runs | Ave | SR | 30+ | Inngs/30+ |
| Till 2011 | 39 | 983 | 32.76 | 120.61 | 11 | 3.55 |
| 2012 onwards | 54 | 1587 | 39.67 | 165.48 | 23 | 2.35 |
| Period | Inngs | Runs | Ave | SR | 30+ | Inngs/30+ |
| Till 2011 | 32 | 604 | 23.23 | 123.01 | 7 | 4.57 |
| 2012 onwards | 32 | 654 | 22.55 | 134.84 | 8 | 4.00 |
de Villiers' most frequent batting position in T20Is has been No. 4, where he has batted 27 times, but he has also played 17 innings at No. 3, and nine at the opening slot. The only position where he has lasted more than 20 balls per dismissal is at No. 4, where he averages 22 deliveries per dismissal. At No. 3 he averages 14 balls per dismissal, and as opener he lasts, on average, 18 balls. Those are underwhelming stats, for the opportunity to bat in the top three should ideally enable him to bat longer periods, and thus make a greater impact on the game. In IPL games, he averages 33 balls per dismissal at No. 3, and 24 per dismissal at Nos. 4 and 5.
| Position | Inngs | Runs | Ave | SR | 30+ | Balls/ dis |
| Opening | 9 | 239 | 26.55 | 145.73 | 4 | 18.22 |
| No. 3 | 17 | 292 | 18.25 | 126.40 | 3 | 14.44 |
| No. 4 | 27 | 584 | 27.80 | 125.59 | 8 | 22.14 |
| No. 5 | 8 | 103 | 14.71 | 114.44 | 0 | 12.86 |
Among the 36 batsmen who have scored at least 750 runs in T20Is when batting in the top five positions, de Villiers' average is 32nd: the only ones with lower averages are Shakib Al Hasan, Tamim Iqbal, Mohammad Hafeez and Ireland's William Porterfield. At the other end of the table are batsmen like Virat Kohli, Faf du Plessis, Kevin Pietersen, and Kane Williamson, which is where you'd think de Villiers belongs as well.
De Villiers' biggest strength is his ball-striking skills, but even his career strike rate of 128.89 is only middling, when compared with other top batsmen. In that list of 36 batsmen, de Villiers' strike rate of 128.21 when batting in the top five is only 18th. Aaron Finch, Pietersen and Chris Gayle all have 35-plus averages at 140-plus strike rates, while Kohli has an incredible average of 52.61 to go with a healthy strike rate of 133.
In the last couple of years, de Villiers' approach in T20Is has been far more frenetic - his strike rate has increased to 149.80 during this period - but his average remains a middling 26.08. For a player of his ability, you'd expect him to be able to score at those rates for longer periods, especially because he has batted in the top four positions in most of the innings during this period.
| Player | Inns | Runs | Average | SR | Balls/dis |
| Shakib Al Hasan | 46 | 932 | 21.67 | 120.10 | 18.05 |
| Tamim Iqbal | 47 | 942 | 21.90 | 109.79 | 19.95 |
| Mohammad Hafeez | 72 | 1531 | 22.18 | 115.63 | 19.19 |
| William Porterfield | 45 | 888 | 22.76 | 111.41 | 20.44 |
| AB de Villiers | 61 | 1218 | 22.98 | 128.21 | 17.92 |
| Kamran Akmal | 39 | 825 | 23.57 | 121.86 | 19.34 |
| Ross Taylor | 59 | 1139 | 24.23 | 119.26 | 20.32 |
| Shoaib Malik | 59 | 1213 | 24.75 | 109.87 | 22.53 |
The numbers for de Villiers, by various stages of a 20-over innings in both T20Is and the IPL, further illustrates the areas where he has been surprisingly ineffective in the internationals. In T20Is, he gets out once every 19 balls in the Powerplay overs, every 17.5 balls in the middle overs, and every 16 deliveries in the last five. Given how quickly he scores in the last five, that rate of dismissal is fine, but he has tended to get out far too often in the Powerplay and in the middle overs.
A comparison with the corresponding IPL numbers brings out this difference quite starkly. The strike rate is lower during the first six, but he bats more deliveries per dismissal, while the difference in the middle overs is huge: the balls per dismissal is almost 13 more in the IPL, resulting in an average difference of 16. In the last five, the balls per dismissal isn't very different, but the strike rate is much higher in the IPL.
De Villiers' numbers in the final overs aren't bad in T20Is, but he is capable of far more in the first 15 overs. Perhaps the World T20 will finally see AB de Villiers live up to his true potential in the T20I format.
| Period | Runs | BF | SR | Dis | Ave | Balls/ dis |
| First 6 overs | 359 | 310 | 115.66 | 16 | 22.43 | 19.38 |
| 6.1 to 15.0 | 625 | 508 | 123.00 | 29 | 21.55 | 17.52 |
| Last 5 overs | 274 | 158 | 173.33 | 10 | 27.40 | 15.80 |
| Period | Runs | BF | SR | Dis | Ave | Balls/ dis |
| First 6 overs | 295 | 280 | 105.33 | 11 | 26.82 | 25.45 |
| 6.1 to 15.0 | 1284 | 1029 | 124.66 | 34 | 37.76 | 30.26 |
| Last 5 overs | 991 | 465 | 213.00 | 25 | 39.64 | 18.60 |
S Rajesh is stats editor of ESPNcricinfo. Follow him on Twitter