Bowling gives England the edge
In a contest between two of the world's best batting teams, the potency of the England attack in home conditions could prove to be the difference
Madhusudhan Ramakrishnan
Jul 19, 2011, 6:20 PM
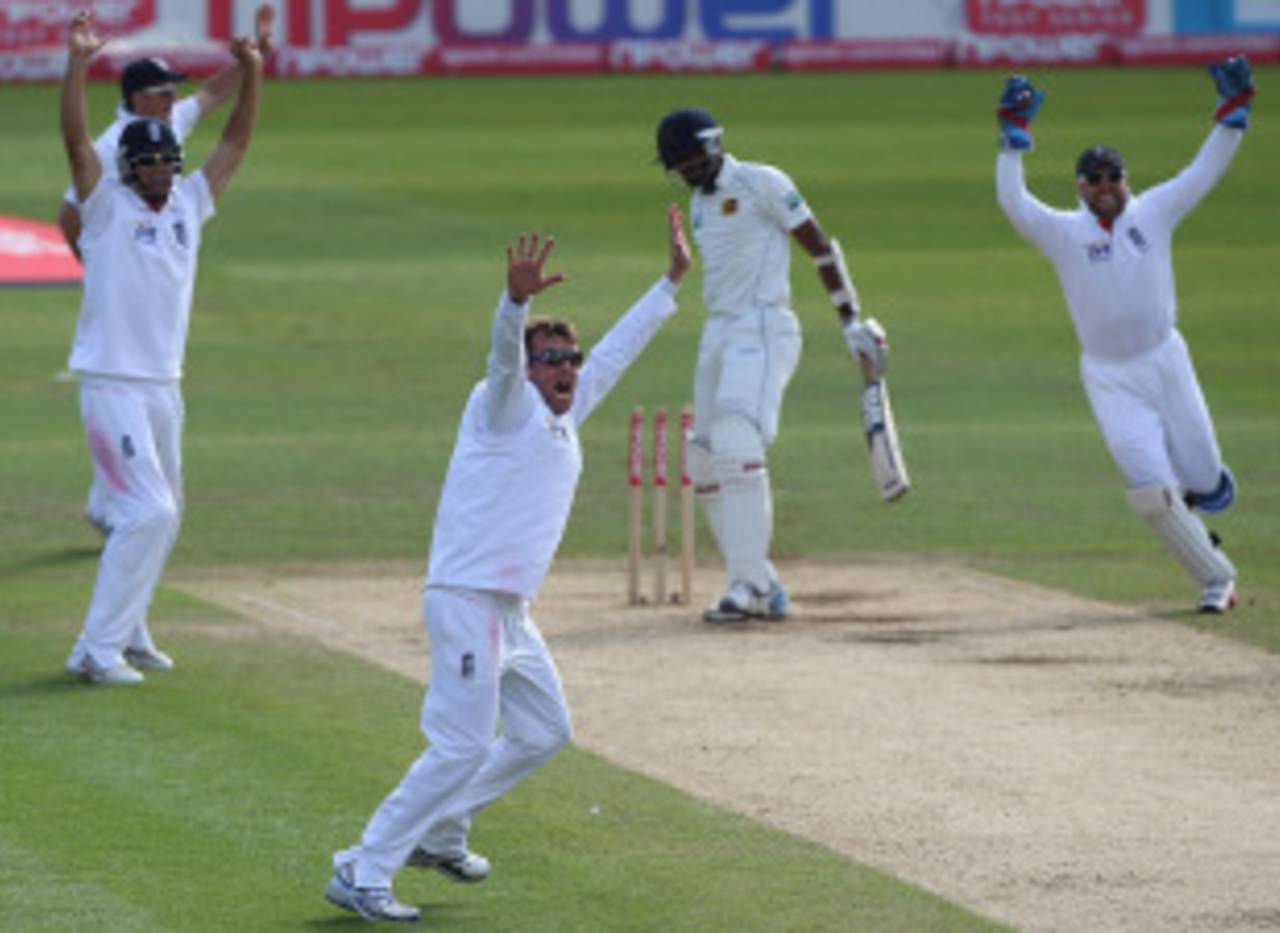
Graeme Swann, who has a strike rate of 47.8 in Tests in England, could be a huge threat to Indian batsmen • Getty Images
Top-of-the-table contest
Since their last clash in 2008, both India and England have gone on to become two of the most dominant teams in Tests. India have not lost a single series under MS Dhoni's captaincy and have won six of their last nine series. After beating Australia at home 2-0 in 2010, India drew their first series in South Africa in 2010-11 by winning the second Test in Durban. England, on the other hand, lost 1-0 to West Indies in a series they controlled for most parts. After grittily holding on for a 1-1 draw in South Africa in 2009-10, England registered emphatic series wins at home against Pakistan and in Australia. The series win in Australia was their first in the country in 24 years, and their superb display was an indication of their much-improved all-round strength.
Since their last clash in 2008, both India and England have gone on to become two of the most dominant teams in Tests. India have not lost a single series under MS Dhoni's captaincy and have won six of their last nine series. After beating Australia at home 2-0 in 2010, India drew their first series in South Africa in 2010-11 by winning the second Test in Durban. England, on the other hand, lost 1-0 to West Indies in a series they controlled for most parts. After grittily holding on for a 1-1 draw in South Africa in 2009-10, England registered emphatic series wins at home against Pakistan and in Australia. The series win in Australia was their first in the country in 24 years, and their superb display was an indication of their much-improved all-round strength.
Both teams have been outstanding with the bat in recent years and average over 40 in Tests since 2008. England also boast a good conversion rate of fifties to centuries (0.54) which is better than that of India (0.45), but well short of South Africa's (0.75) in the same period. India's top-order batsmen have scored quicker and have been more consistent than their English counterparts, but the absence of the aggressive Virender Sehwag is a huge dent to India's chances. On the bowling front, England have been the better team. They average 32.08 in Tests since 2008 and their average difference of 8.00 (batting average minus bowling average) is second only to that of South Africa (11.14). India have a fairly high bowling average of nearly 37 which puts them at a slight disadvantage going into a series that could determine the top Test team. However, England, who have to win the series by at least a two-Test margin to become the top-ranked Test side, have not won two Tests in a home series against India since the 3-0 win in 1974.
| Team | W/L ratio | Batting average | Bowling average | Average diff | 100/50 | 5WI/10WM |
| South Africa | 2.12 | 42.69 | 31.55 | 11.14 | 50/66 | 19/2 |
| England | 2.33 | 40.08 | 32.08 | 8.00 | 57/106 | 33/3 |
| Sri Lanka | 1.66 | 43.19 | 37.76 | 5.43 | 37/62 | 16/3 |
| India | 2.57 | 40.85 | 36.97 | 3.88 | 53/118 | 16/3 |
| Australia | 1.28 | 37.26 | 35.03 | 2.23 | 46/122 | 24/3 |
India hold advantage in recent clashes
England clearly have the upper hand in the 99 Tests played between the two teams so far. India, who have won 19 Tests and lost 34, have been the better side in home Tests but quite ordinary in England. But their display in England in recent times has been encouraging. They came back from behind to level the series 1-1 in 2002, and went on to win the series 1-0 in 2007 after winning the second Test at Trent Bridge. Despite ordinary batting and bowling performances against England overall, India have clearly been the better side in Tests since 2000 winning five and losing two. Their batting average of 39.03 and bowling average of 35.60 gives them an average difference of 3.43.
England clearly have the upper hand in the 99 Tests played between the two teams so far. India, who have won 19 Tests and lost 34, have been the better side in home Tests but quite ordinary in England. But their display in England in recent times has been encouraging. They came back from behind to level the series 1-1 in 2002, and went on to win the series 1-0 in 2007 after winning the second Test at Trent Bridge. Despite ordinary batting and bowling performances against England overall, India have clearly been the better side in Tests since 2000 winning five and losing two. Their batting average of 39.03 and bowling average of 35.60 gives them an average difference of 3.43.
| Played | Won | Lost | Drawn | Batting avg | Bowling avg | |
| Overall | 99 | 19 | 34 | 46 | 30.91 | 37.00 |
| In England | 48 | 5 | 23 | 20 | 28.13 | 41.50 |
| Since 2000 | 15 | 5 | 2 | 8 | 39.03 | 35.60 |
| In England since 2000 | 7 | 2 | 1 | 4 | 42.46 | 39.84 |
India's poor record at Lord's and Edgbaston
Although India have been successful on recent visits to England, their record at Lord's, the venue for the first Test, will worry them. Apart from their solitary win in1986, they haven't had much success, losing ten Tests at the venue. In contrast, England, who struggled to win a Test at Lord's for much of the 1980s and 1990s, have won 12 and lost just three matches at the venue since 2000. England's batting average (43.56) and average difference (13.00 ) at Lord's is by far their best at any home ground during this period. India, who won at Trent Bridge and drew at The Oval in the 2007 series, have a poor record in Edgbaston, where they have lost four out of five Tests.
Although India have been successful on recent visits to England, their record at Lord's, the venue for the first Test, will worry them. Apart from their solitary win in1986, they haven't had much success, losing ten Tests at the venue. In contrast, England, who struggled to win a Test at Lord's for much of the 1980s and 1990s, have won 12 and lost just three matches at the venue since 2000. England's batting average (43.56) and average difference (13.00 ) at Lord's is by far their best at any home ground during this period. India, who won at Trent Bridge and drew at The Oval in the 2007 series, have a poor record in Edgbaston, where they have lost four out of five Tests.
Among grounds that have hosted at least eight Tests since 2000, Lord's and The Oval have been the best batting venues. A combination of the fickle weather and better batting conditions have meant that the draw percentage at these two venues is the highest among English grounds (34.78 at Lord's and 27.27 at The Oval). In Tests since 2000, Edgbaston and Trent Bridge have low batting averages of 32.68 and 29.53, and hence a very low draw percentage of just 20.
| Ground | Played | Won | Lost | Drawn | Batting avg | Bowling avg |
| Lord's | 23 | 12 | 3 | 8 | 43.56 | 30.56 |
| The Oval | 11 | 6 | 2 | 3 | 37.56 | 35.55 |
| Edgbaston | 10 | 5 | 3 | 2 | 32.09 | 33.25 |
| Trent Bridge | 10 | 5 | 3 | 2 | 30.28 | 28.77 |
| Headingley | 9 | 5 | 4 | 0 | 34.43 | 33.93 |
| Old Trafford | 9 | 6 | 1 | 2 | 39.89 | 28.56 |
Top-class batting teams
During a phase in which India and England have enjoyed great success in Tests, the batting line-ups of both teams have been in top form. Sachin Tendulkar, who is on verge of scoring his 100th international century, has been exceptional in the last three years. He has scored 14 centuries and 11 fifties at an average of 65.21 in Tests since January 2008. His conversion rate of fifties to centuries in the same period (1.27) is much higher than his corresponding career mark (0.86). Gautam Gambhir and VVS Laxman have also been among the runs with Laxman, in particular, contributing in vital causes in Mohali and Durban. Laxman has, however, had a fairly ordinary time against England in Tests and averages just 34.35 in 20 innings.
During a phase in which India and England have enjoyed great success in Tests, the batting line-ups of both teams have been in top form. Sachin Tendulkar, who is on verge of scoring his 100th international century, has been exceptional in the last three years. He has scored 14 centuries and 11 fifties at an average of 65.21 in Tests since January 2008. His conversion rate of fifties to centuries in the same period (1.27) is much higher than his corresponding career mark (0.86). Gautam Gambhir and VVS Laxman have also been among the runs with Laxman, in particular, contributing in vital causes in Mohali and Durban. Laxman has, however, had a fairly ordinary time against England in Tests and averages just 34.35 in 20 innings.
Among England's batsmen, Alastair Cook and Jonathan Trott have shown tremendous consistency in the last two years. Cook, who has scored nine centuries in his last 30 innings, was England's top run getter in their 3-1 Ashes victory. Since his century on debut against Australia in 2009, Trott has had an excellent run. He has scored six centuries at an average of 62.23 and boasts a superb record at Lord's, where he has scored two centuries and a half-century in his last five innings. Andrew Strauss, who was badly out of form against Sri Lanka, came good in the warm up match against India, and will take confidence from the fact that he scored twin tons in the first Test of the 2008 series against India in Chennai.
| Batsman | Innings | Runs | Average | 100/50 |
| Sachin Tendulkar | 59 | 3326 | 65.21 | 14/11 |
| Gautam Gambhir | 45 | 2542 | 60.52 | 8/13 |
| VVS Laxman | 62 | 2786 | 55.72 | 5/22 |
| Jonathan Trott | 34 | 1867 | 62.23 | 6/6 |
| Ian Bell | 50 | 2227 | 53.02 | 8/11 |
| Alastair Cook | 74 | 3584 | 51.94 | 11/18 |
Sehwag's absence crucial
Cook and Strauss, England's most prolific opening pair, have been involved in 11 century stands in Tests since 2008. In the same period, Cook has also forged highly successful partnerships with Kevin Pietersen and Trott. While the Pietersen-Cook pair has averaged over 75 with seven century partnerships, the Trott-Cook combination has averaged 72.88 and converted five of the six fifty-plus stands into century partnerships.
India could sorely miss the services of Sehwag, who formed India's most successful opening combination with Gambhir. Sehwag's average against England is just 31, but he was also the one who set up India's successful chase of 387 against England in Chennai with a quickfire 83 off 68 balls, and has scored at a strike rate of nearly 91 in Tests since January 2008. The pairing of Tendulkar and Rahul Dravid, however, is the key in the Indian middle order. They are among the most prolific batting pairs in Test history, and are only 130 runs behind the all-time leading pairing of Gordon Greenidge and Desmond Haynes.
| Pair | Innings | Runs | Average | 100/50 |
| Alastair Cook, Andrew Strauss | 68 | 3061 | 46.37 | 11/11 |
| Alastair Cook, Kevin Pietersen | 22 | 1512 | 75.60 | 7/5 |
| Alastair Cook, Jonathan Trott | 19 | 1312 | 72.88 | 5/1 |
| Rahul Dravid, Gautam Gambhir | 30 | 1651 | 56.93 | 5/5 |
| Rahul Dravid, Sachin Tendulkar | 30 | 1324 | 47.28 | 4/6 |
| VVS Laxman, Sachin Tendulkar | 27 | 1305 | 52.20 | 4/7 |
England's bowling more potent
In a series that pits two of the top batting line-ups in the world against each other, the outcome is more likely to depend on the form of the bowling attacks. James Anderson and Graeme Swann are England's in-form bowlers and have been highly effective in English conditions. Anderson, who has over 200 wickets at an average of 31, has been even better at Lord's with 36 wickets in nine Tests at an average just over 28. Anderson has also been successful against top Indian batsmen dismissing Tendulkar on five occasions and Dravid on three. Swann, who made his debut against India in Chennai in 2008, has added a new dimension to England's attack. While his overall average (27.72) and strike rate (57.5) are impressive enough, his corresponding numbers in England (average 23 and strike rate 47) are quite stunning. Chris Tremlett, who had match figures of 6 for 92 in England's seven-wicket defeat against India at Trent Bridge in 2007, has picked up 32 wickets in six Tests at an average of 23.37 since his return in 2010, and will be a major threat on pace-friendly tracks.
In a series that pits two of the top batting line-ups in the world against each other, the outcome is more likely to depend on the form of the bowling attacks. James Anderson and Graeme Swann are England's in-form bowlers and have been highly effective in English conditions. Anderson, who has over 200 wickets at an average of 31, has been even better at Lord's with 36 wickets in nine Tests at an average just over 28. Anderson has also been successful against top Indian batsmen dismissing Tendulkar on five occasions and Dravid on three. Swann, who made his debut against India in Chennai in 2008, has added a new dimension to England's attack. While his overall average (27.72) and strike rate (57.5) are impressive enough, his corresponding numbers in England (average 23 and strike rate 47) are quite stunning. Chris Tremlett, who had match figures of 6 for 92 in England's seven-wicket defeat against India at Trent Bridge in 2007, has picked up 32 wickets in six Tests at an average of 23.37 since his return in 2010, and will be a major threat on pace-friendly tracks.
Zaheer Khan, who is returning after injury, could be India's key bowler in conditions that are likely to aid swing and seam. Zaheer has an excellent record against three of England's top batsmen, dismissing Strauss and Ian Bell five times each and Cook three times. Harbhajan Singh's away performance has improved somewhat over the last three years, but a comparison with Swann clearly shows who has been the better bowler during this period: compared with Swann's strike rate of 57.5, Harbhajan has bowled 71 deliveries per wicket, which indicates he hasn't been getting his wickets quickly enough.
| Bowler | Matches | Wickets | Average | SR | 5WI/10WM |
| James Anderson | 39 | 157 | 27.81 | 55.1 | 7/1 |
| Graeme Swann | 32 | 140 | 27.72 | 57.5 | 10/1 |
| Harbhajan Singh | 35 | 153 | 33.24 | 71.0 | 5/1 |
| Zaheer Khan | 25 | 101 | 29.16 | 52.9 | 5/1 |